Studies of Iron Age artefacts from Britain tend to be dominated either by the study of metalwork, or pottery. This book presents a study not only of a different material, but also a different type of object: glass beads. These are found in a range of different sizes, shapes, colours, and employ a variety of different decorative motifs. Through an analysis of glass beads from four key study regions in Britain, the book aims not only to address regional differences in appearance and chronology, but also to explore the role that this object played within the networks and relationships that constructed Iron Age society. It seeks to understand how they were used during their lives and how they came to be deposited within the archaeological record, in order to establish the social processes that glass beads were bound within. The results indicate that glass beads were a strongly regionalised artefact, potentially reflecting differing local preferences for colour and motif. In addition, glass beads, in combination with several other types of object, were integral to Middle Iron Age dress. Given that the first century BC is often seen as a turning point in terms of settlements and material culture, this supports the possibility of strong continental exchange during an earlier period for either glass beads or raw materials. However, by the Late Iron Age in the first century BC and early first century AD, their use had severely diminished.
eBook - PDF
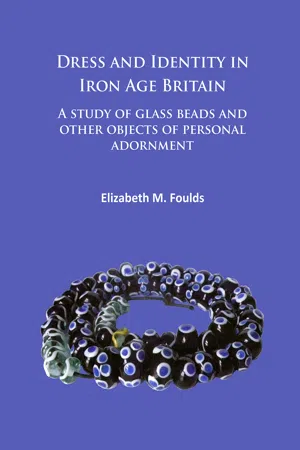
Dress and Identity in Iron Age Britain
A study of glass beads and other objects of personal adornment
- 357 pages
- English
- PDF
- Available on iOS & Android
eBook - PDF
Dress and Identity in Iron Age Britain
A study of glass beads and other objects of personal adornment
About this book
Trusted by 375,005 students
Access to over 1.5 million titles for a fair monthly price.
Study more efficiently using our study tools.
Information
Table of contents
- Cover
- Title Page
- Copyright Page
- Contents
- Preface
- Copyright Information & Image Acknowledgements
- Sites Mentioned in Text
- Chapter 1 Introduction
- Aims_of_current_research
- Figure 1: Compilation map of all of Guido’s (1978a) original data.
- Figure 2: Identification of project study regions.
- Layout_of_thesis
- Chapter 2 Previous Approaches to Glass Beads
- Figure 3: Guido’s (redrawn after 1978a Figure 1) sixteen decorative motifs.
- Figure 4: Schematic diagram of Guido’s Iron Age and Roman glass bead classification (redrawn after 1978a Plates I & II, Figu e 19, 23, 37).
- Figure 5: Applying linear decoration during glass bead manufacture.
- Figure 6: Haevernick’s (1960) eight main types of beads (author’s translation).
- Introduction
- People_and_Objects
- Chapter 3 Glass Beads & Dress
- Figure 7: Details from the Gundestrup Cauldron (held in collections at National Museum of Denmark). (a) Detail of antler figure, interior Plate A, (b) Detail of panel, exterior Plate F.
- Figure 8: Drawing of the Roos Carr figures from East Yorkshire (held in collections at Hull & East Riding Museums:Hull Museums KINCM:1991.141.10876).
- Figure 9: Back view of chalk figurine from East Yorkshire (Hull & East Riding Museums:Hull Museums KINCM:2006.11303.4576).
- Chapter_4_The_Iron_Age_to_Earl
- Southwest_England
- Chapter 4 The Nature of the Archaeological Resource in the Regions
- Figure 10: Key sites in Southwest England mentioned in the text.
- Figure 11: Key sites in East Anglia mentioned in the text.
- Figure 12: Key sites in East Yorkshire mentioned in the text.
- Figure 13: Key sites in Northeast Scotland mentioned in the text.
- Discussion
- Chapter_5_Typology_Conundrums_
- Chapter 5 Typological Conundrums, Quandaries, and Resolutions
- Figure 14: List of Guido classes and the number of examples recorded by Guido, compared to the number contained in the database that resulted from the current research. It also shows the number of beads that were studied first-hand.
- Figure 15: List of Guido Groups and the number of examples included in her catalogue, compared to the number contained in the database that resulted from the current research. It also shows the number of examples that were studied first-hand.
- Figure 16: (a) Scatter-graph showing the overall size of Class 1 beads by Guido sub-type, and pie-charts showing (b) the proportion of different number of eye motifs and (c) the proportion of different types of shaped Guido Class 1 beads.
- Figure 17: Analysis of Guido Class 3 beads (a) Scatter-graph showing the overall size, and pie-charts showing (b) the propor ion of beads by number of eyes, (c) the proportion of different colours used for the body of the bead, and
- Figure 17: Analysis of Guido Class 3 beads (d) the proportion of different colours used for decoration.
- Figure 18: Analysis of Guido Class 10 and 13 beads (a) pie-chart showing the proportion of different Guido Class 10 shapes, (b) pie-chart showing the proportion of different colours of glass used for the body of Guido Class 13 beads.
- Figure 18: Analysis of Guido Class 10 and 13 beads (c) scatter-graph of Guido Class 10 beads showing dimensions and shape, and (d) scatter-graph of Guido Class 13 beads showing dimensions and shape.
- Figure 19: Comparison of Guido Class 7, 9, and 14 beads (a) scatter-graph comparing overall size.
- Figure 19: Comparison of Guido Class 7, 9, and 14 beads (b) bar-charts comparing the proportion of Class 7 body and (c) deco ative colours.
- Figure 19: Comparison of Guido Class 7, 9, and 14 beads (d) bar-charts comparing the proportion of Class 9 body and (e) deco ative colours.
- Figure 19: Comparison of Guido Class 7, 9, and 14 beads (f) bar-charts comparing the proportion of Class 14 body and (g) decorative colours.
- Figure 20: Scatter-graph comparing the dimensions of Guido Class 8 beads.
- Figure 21: Scatter-graph comparing the dimensions of Guido Group 6 and 7 beads with guideline for perfect sphere (x) and ‘annular’ shape (x/2).
- Figure 22: Schematic diagram of Guido typology chronology in typological order.
- Figure 23: Schematic diagram of Guido typology chronology in chronological order.
- Discussion-1
- Figure 24: Schematic diagram showing the hierarchy of new glass bead types.
- Figure 25: Frequency of Class 1 beads in the study regions.
- Figure 26: Frequency of Class 2 beads in the study regions.
- Figure 27: Frequency of Class 3 beads in the study regions.
- Figure 28: Frequency of Class 4 beads in the study regions.
- Figure 29: Frequency of Class 5 beads in the study regions.
- Figure 30: Frequency of Class 6 beads in the study regions.
- Figure 31: Frequency of Class 7 beads in the study regions.
- Figure 32: Frequency of Class 8 beads in the study regions.
- Figure 33: Frequency of Class 9 beads in the study regions.
- Figure 34: Frequency of Class 10 beads in the study regions.
- Figure 35: Frequency of Class 11 beads in the study regions.
- Figure 36: Summary table of presence and absence of new types. (1) Southwest England, (2) East Anglia, (3) East Yorkshire, and (4) Northeast Scotland.
- Chronology
- Southwest_England-1
- Figure 37: Bar chart showing the frequency of total datable glass beads in study regions.
- Figure 38: Bar chart showing (a) the frequency and (b) the percentage of total datable glass beads by study region.
- East_Anglia-1
- East_Yorkshire-1
- Northeast_Scotland-1
- Chronology_Discussion
- Discussion-2
- Figure 39: Bar chart showing (a) the number and (b) the percentage of the quantity of colours of glass beads over time.
- Figure 40: Bar chart showing (a) the number and (b) the percentage of different general motif type over time.
- Conclusion-3
- Chapter 6 Form and Regional Identity
- Shape
- Size
- Figure 41: Number of glass beads per study region.
- Figure 42: Bar-chart showing the frequency of shape for all study regions combined.
- Figure 43: Bar-charts showing the use of bead shapes in (a) Southwest England, (b) East Anglia, (c) East Yorkshire, and (d) Northeast Scotland.
- Figure 44: Bar-chart comparing (a) the frequency of glass bead shape and (b) the percentage of glass bead shape between the our study regions.
- Figure 45: (a) Descriptive statistics for Diameter/Width measurement.
- Figure 45: (b) histogram of the Diameter/Width measurement of glass beads for all beads in study regions.
- Figure 46: Histogram showing Diameter/Width measurement for (a) Southwest England, (b) East Anglia, (c) East Yorkshire, and (d) Northeast Scotland.
- Figure 47: (a) Descriptive statistics for Height measurement.
- Figure 47: (b) histogram of the Height measurement of glass beads for all beads in study regions.
- Figure 48: Histogram showing Height measurement for (a) southwest England, (b) East Anglia, (c) East Yorkshire, (d) Northeast Scotland.
- Figure 49: (a) Descriptive statistics for Perforation Diameter measurement.
- Figure 49: (b) histogram of the Perforation Diameter measurement of glass beads for all beads in study regions.
- Figure 50: Histogram showing Perforation Diameter measurement for (a) Southwest England, (b) East Anglia, (c) East Yorkshire, (d) Northeast Scotland.
- Figure 51: Scatter-graph plotting the Diameter/Width measurement against the Height measurement for all beads in study regions.
- Figure 52: Scatter-graph plotting the Diameter/Width against the Height for beads from (a) Southwest England, (b) East Anglia.
- Figure 52: Scatter-graph plotting the Diameter/Width against the Height for beads from (c) East Yorkshire, (d) Northeast Scotland.
- Figure 53: Scatter-graph plotting the Diam:Height ratio against the Perforation Diameter measurement for all beads in study regions.
- Figure 54: Scatter-graph plotting the Diam:Height ratio against the Perforation Diameter for beads from (a) Southwest England, (b) East Anglia.
- Figure 54: Scatter-graph plotting the Diam:Height ratio against the Perforation Diameter for beads from (c) East Yorkshire, (d) Northeast Scotland.
- Figure 55: (a) Descriptive statistics for Weight measurement for beads from all study regions (grams).
- Figure 55: (b) histogram showing the combined Weight distribution for all study regions.
- Figure 56: Histogram showing Weight measurement for (a) Southwest England, (b) East Anglia, (c) East Yorkshire, (d) Northeast Scotland.
- Figure 57: Scatter-graph comparing the Diameter/Width and Height measurements for glass beads forming possible necklaces, or found in burial contexts in Southwest England.
- Figure 58: Scatter-graph comparing the Diameter/Width and Height measurements for glass beads forming possible necklaces, or found in burial contexts in East Yorkshire.
- Colour
- Monochrome
- Polychrome
- Figure 59: Bar-chart comparing the frequency of colour occurrence in all four study regions.
- Figure 60: Bar-chart comparing the (a) frequency, and (b) percentage of colour occurrence in the four study regions.
- Figure 61: Bar-chart comparing the (a) frequency, and (b) percentage of colours on each bead between study regions.
- Figure 62: Bar-chart showing the frequency of colours for monochrome beads for all study regions.
- Figure 63: Bar-chart comparing the (a) frequency, and (b) percentage of monochrome beads that occur in each study region.
- Figure 64: (a) Diagram showing the colour combinations of bi-colour beads in Southwest England, and (b) bar-chart showing the frequency of bi-colour combinations in Southwest England.
- Figure 65: (a) Diagram showing the colour combinations of bi-colour beads in East Anglia, and (b) bar-chart showing the freuquency of bi-colour combinations in East Anglia.
- Figure 66: (a) Diagram showing the colour combinations of bi-colour beads in East Yorkshire, (b) bar-chart showing the frequency of bi-colour glass beads in East Yorkshire.
- Figure 67: (a) Diagram showing the colour combinations of bi-colour beads in Northeast Scotland, and (b) bar-chart showing the frequency of bi-colour combinations from Northeast Scotland.
- Figure 68: List of colour combinations used on glass beads made from two colours of glass and the frequency in each study region.
- Figure 69: Bar-chart showing the (a) frequency, and (b) percentage, of individual colours for polychrome beads with two colours in all four study regions.
- Figure 70: (a) Diagram showing the colour combinations of tri-colour beads in Southwest England, and (b) bar-chart showing the frequency of tri-colour glass beads in Southwest England.
- Figure 71: (a) Diagram showing the colour combinations of tri-colour beads in East Anglia, and (b) bar-chart showing the frequency of tri-coloured glass beads from East Anglia.
- Figure 72: (a) Diagram showing the colour combinations of tri-colour beads in East Yorkshire, and (b) bar-chart showing the requency of tri-coloured glass beads from East Yorkshire.
- Figure 73: (a) Diagram showing the colour combinations of tri-colour beads in Northeast Scotland.
- Figure 73: (b) bar-chart showing the frequency of tri-coloured glass beads in Northeast Scotland.
- Figure 74: List of colour combinations for glass beads with three colours of glass and the frequency in each study region.
- Figure 75: Bar-chart showing the (a) frequency, and (b) percentage, of individual colours for polychrome beads with three colours in all four study regions.
- Figure 76: Diagram showing the combinations of four colours found on glass beads in Southwest England.
- Figure 77: Diagram showing the colour combinations of four colours beads in Northeast Scotland.
- Figure 78: (a) Bar-chart showing the frequency of individual colours for polychrome beads with four colours in all four study regions, and (b) bar-chart showing the percentage of individual colours for polychrome beads with four colours in all four study
- Figure 79: (a) Bar-chart showing the combined frequency of bead body colour across all study regions, and (b) bar-chart showing the combined frequency of bead decorative colour across all study regions.
- Figure 80: Bar-chart showing the use of body colour of polychrome beads in (a) Southwest England and (b) East Anglia.
- Figure 80: Bar-chart showing the use of body colour of polychrome beads in (c) East Yorkshire and (d) Northeast Scotland.
- Decorative_Motif
- Figure 81: List of colours and colour combinations found on the body of the bead and the frequency in each study region.
- Figure 82: Bar-chart showing the use of decorative colour for polychrome beads in (a) Southwest England and (b) East Anglia.
- Figure 82: Bar-chart showing the use of decorative colour for polychrome beads in (c) East Yorkshire and (d) Northeast Scotland.
- Figure 83: List of colours and colour combinations found as decorative motif on the bead and the frequency in each study regio .
- Figure 84: Bar-chart showing the frequency of glass beads by body colour and corresponding decorative colours by study region. Colour words to the left of the hyphen indicate body colour, and colour words to the right of the hyphen indicate decorative col
- Figure 84: Bar-chart showing the frequency of glass beads by body colour and corresponding decorative colours by study region. Colour words to the left of the hyphen indicate body colour, and colour words to the right of the hyphen indicate decorative col
- Figure 84: Bar-chart showing the frequency of glass beads by body colour and corresponding decorative colours by study region. Colour words to the left of the hyphen indicate body colour, and colour words to the right of the hyphen indicate decorative col
- Figure 84: Bar-chart showing the frequency of glass beads by body colour and corresponding decorative colours by study region. Colour words to the left of the hyphen indicate body colour, and colour words to the right of the hyphen indicate decorative col
- Discussion-3
- Figure 85: Summary table correlating motif with new classification.
- Figure 86: Bar-chart showing the frequency of general motif types for all four study regions.
- Figure 87: Bar-chart showing the (a) frequency, and (b) percentage of general motif types in all four study regions.
- Figure 88: List of all decorative motifs and their frequency within each study region.
- Figure 89: Bar-chart showing the use of decorative motif in (a) Southwest England.
- Figure 89: Bar-chart showing the use of decorative motif in (b) East Anglia, (c) East Yorkshire.
- Figure 89: Bar-chart showing the use of decorative motif in (d) Northeast Scotland.
- Figure 90: Bar-chart showing the (a) frequency of complex decorative motif in all four study regions.
- Figure 90: Bar-chart showing the (b) percentage of complex decorative motif in all four study regions.
- Conclusion-4
- Figure 91: Summary table of generalised regional characteristics.
- Chapter_7_Regional_Distributio
- Chapter 7 Archaeological Context
- Typology_Distribution
- Figure 92: Overall distribution of glass beads in Britain. Drawing on data from the Guido (1978a) catalogue and new additions in the research database.
- Figure 93: Maps of study regions showing density of typed glass beads. (a) Southwest England, (b) East Anglia, (c) East Yorkshire, (d) Northeast Scotland. No colour = bead absence, yellow = low density, red = high density.
- Figure 94: Size of region, number of typed glass beads, and beads per square mile in each study region (all excavated glass beads and stray beads included).
- Figure 95: Comparison of the distribution of Guido Class 1 beads in (a) Southwest England and (b) East Yorkshire.
- Figure 96: Comparison of the distribution of Class 4 blue and white beads in (a) Southwest England and (b) East Yorkshire.
- Archaeological_Resource
- Figure 97: Distribution of colourless and opaque yellow glass beads in four study regions. (a) Southwest England, (b) East A glia, (c) East Yorkshire, (d) Northeast Scotland.
- Figure 98: Distribution of blue and white glass beads in the four study regions. (a) Southwest England, (b) East Anglia, (c) East Yorkshire, (d) Northeast Scotland.
- Figure 100: Chart showing the frequency of developer funded reports (included in the research) by publication year since 1991 and also showing the frequency of glass bead finds.
- Figure 101: Table showing the frequency of excavations by type and the frequency of presence or absence of glass beads.
- Figure 99: Comparison of the number of records in the database, with the number of excavation events, and the number of individual excavated sites.
- Figure 102: (a) Bar-chart showing the frequency of different types of excavations in each study region, (b) Bar-chart showing the proportion of different types of excavations in each study region.
- Figure 103: (a) Bar chart showing the relative percentage of different types of excavations in each study region with no typed glass beads, (b) Bar chart showing the relative percentage of different types of excavations in each region with typed glass be
- Figure 104: Table comparing the different types of excavations where typed glass beads were not found in the region.
- Figure 105: Table comparing the frequency of different types of excavations where typed glass beads were found.
- Figure 106: Maps showing the density of research and developer-led excavations within each study region. The white diamonds represent glass beads found through excavation, and the black diamonds represent other typed glass beads, usually found as stray fi
- Figure 107: Maps showing locations of excavations. ‘X’ represents sites where no glass beads were found and circles represent were typed glass beads were found. Colour differentiates the type of excavation: Green=developer-led, Red=research, Blue=rescue,
- Figure 108: Maps showing the size (square meters) of excavations in (a) Southwest England, (b) East Anglia, (c) East Yorkshire, (d) Northeast Scotland.
- Figure 109: Chart showing the frequency of excavation size by study region.
- Figure 110: Chart showing the frequency of excavation size and whether typed glass beads were present.
- Site_Type
- Figure 111: Bar-chart showing the frequency of different site types in all four study regions.
- Figure 112: Bar-chart showing the (a) frequency, and (b) relative proportion of site types between study regions.
- Figure 113: List of the number of different types of sites and whether glass beads were present.
- Figure 114: Chi-square data for type of site and presence of glass beads. Note that some categories from Figure 113 have been condensed in order to create valid results in the chi-square test.
- Figure 115: Bar-chart showing the frequency of sites where typed glass beads were found.
- Figure 116: Bar-chart showing the (a) frequency, and (b) proportion of site types where typed glass beads were found by study region.
- Figure 117: Bar-chart showing the frequency of the occurrence of activity from different periods for all study regions.
- Figure 118: Bar-chart showing the (a) frequency, and (b) percentage of activity from different periods within each region.
- Figure 119: Bar-chart showing the frequency of sites and general period where typed glass beads were (a) not found at, and (b) present.
- Figure 120: Sites in Southwest England with activity dating to the Late Bronze Age/Early Iron Age with glass beads.
- Figure 121: Sites with activity dating to the Middle Iron Age/Late Iron Age with glass beads (a) Southwest England, (b) East Anglia, (c) East Yorkshire.
- Figure 122: Sites with activity dating to the Late Iron Age/Early Roman period with glass beads (a) Southwest England, (b) Northeast Scotland.
- Figure 123: Sites with activity dating to the Early Roman/Romano-British period with glass beads (a) Southwest England, (b) East Anglia, (c) East Yorkshire.
- Figure 124: Sites with activity dating to the post-Roman/Anglo-Saxon period with glass beads (a) Southwest England, (b) Northeast Scotland.
- Figure 125: Bar-chart showing the number of colours of glass on each bead in Southwest England (a) frequency, (b) percentage.
- Figure 126: Bar-chart showing the number of colours of glass on each bead in East Anglia (a) frequency, (b) percentage.
- Figure 127: Bar-chart showing the number of colours of glass on each bead in East Yorkshire (a) frequency, (b) percentage.
- Figure 128: Bar-chart showing the number of colours of glass on each bead in Northeast Scotland (a) frequency, (b) percentage.
- Context_Type
- Figure 129: Bar-chart showing the frequency of glass beads at different site types in Southwest England (a) frequency, (b) percentage.
- Figure 130: Bar-chart showing the frequency of glass beads at different site types in East Anglia (a) frequency, (b) percentage.
- Figure 131: Bar-chart showing the frequency of glass beads at different site types in East Yorkshire (a) frequency, (b) percentage.
- Figure 132: Bar-chart showing the frequency of glass beads at different site types in Northeast Scotland (a) frequency, (b) percentage.
- Figure 133: Chart showing the proportion of glass bead complexity rank (combining colour and decorative motif) by (a) study egions, (b) site type. Rank is from most simple (1) to most complex (5).
- Figure 134: Glass bead feature analysis for Southwest England (a) bar-chart of glass bead frequency by feature, (b) comparison of site type and feature type, (c) comparison of feature and period of activity.
- Figure 134: Glass bead feature analysis for Southwest England. (d) Comparison of Classes and features.
- Figure 135: Glass bead feature analysis for East Anglia (a) bar-chart of glass bead frequency by feature, (b) comparison of site type and feature type, (c) comparison of feature and period of activity.
- Figure 135: Glass bead feature analysis for East Yorkshire. (d) Comparison of Classes and features.
- Figure 136: Glass bead feature analysis for East Yorkshire (a) bar-chart of glass bead frequency by feature, (b) comparison of site type and feature type, (c) comparison of feature and period of activity.
- Figure 136: Glass bead feature analysis for East Yorkshire. (d) Comparison of Classes and features.
- Figure 137: Glass bead feature analysis for Northeast Scotland (a) bar-chart of glass bead frequency by feature, (b) comparison of site type and feature type, (c) comparison of feature and period of activity.
- Figure 137: Glass bead feature analysis for Northeast Scotland. (d) Comparison of Classes and features.
- Figure 138: Bar-chart showing the number of beads found within single contexts.
- Figure 139: List of sites where glass beads were found in pit contexts.
- Figure 140: Table comparing the different types of objects found in pits with glass beads.
- Figure 141: List of sites where glass beads were found in inhumations in Southwest England.
- Figure 142: List of sites where glass beads were found in inhumations in East Yorkshire.
- Figure 143: Frequency of inhumations in East Yorkshire.
- Chapter_8_Regional_Bodily_Ador
- Evidence_for_how_glass_beads_w
- Chapter 8 Regional Bodily Adornment
- Figure 144: Illustration showing four different lengths of necklaces to demonstrate the different effects of differing lengths of strands of glass beads.
- Figure 145: Bar chart comparing the number of glass beads in each possible necklace with the estimated length of each strand o beads in East Yorkshire.
- Figure 146: Comparison of East Yorkshire burials and bead types. Dark grey highlight indicates bead types that are repeated ac oss necklaces, light grey highlight indicates bead types that only occur singly on one necklace and are not found elsewhere.
- Figure 147: Scatter-graph comparing the size of all East Yorkshire glass beads from burials.
- Figure 148: Scatter-graph comparing the size of four different bead types from East Yorkshire burials: (a) Type 102, (b) Type 417, (c) Type 421, (d) Type 901.
- Figure 149: Comparison of different motifs found on East Yorkshire necklaces.
- Figure 150: Hypothetical reconstruction of glass beads from Wetwang Slack: (a) Burial 209, (b) Burial 274, (c) Burial 249.⤀
- Figure 151: Hypothetical reconstructions using 120 glass beads. (a) 4-strand tassel, (b) 40-strand tassel with three beads per strand, (c) continuous loop of beads.
- Figure 152: List of sites where glass beads were found in inhumations in East Yorkshire.
- Figure 153: Comparison of different artefact types and their location on the body where known from East Yorkshire.
- Figure 154: Bar-chart showing the frequency of dress objects within 127 inhumations in East Yorkshire (groups of beads that likely formed a necklace or other object are counted once).
- Figure 155: Bar-chart showing the frequency of different dress objects within 127 inhumations in East Yorkshire.
- Figure 156: Illustration of different body zones and terms.
- Figure 157: Pie-chart showing the proportions of artefacts and the body zones that they were found in association with (beaded necklaces are only counted as one instance).
- Figure 158: List of sites where glass beads were found in inhumations in Southwest England.
- Figure 159: Bar-chart comparing the number of glass beads and length of glass bead strand for each possible strand of glass beads in Southwest England.
- Figure 160: Hypothetical reconstruction of glass beads from Southwest England: (a) glass and stone beads from Chesil mirror burial, Dorset, (b) glass beads from the Cleveland Cist burial, Somerset, (c) glass, faience, and wood(?) beads from Burial 8 Whitc
- Figure 161: Bar chart showing the frequency of the number of objects of dress within each Southwest England inhumation (27 inhumations, 40 objects).
- Figure 162: Comparison of different object types and their location on the body in Southwest England.
- Figure 163: Pie-chart comparing the location of 28 objects in connection with the body in Southwest England.
- Compare_glass_beads_with_other
- Figure 164: Bar-chart showing the number of glass beads and the length of a strand of beads if strung together.
- Figure 165: Hypothetical reconstruction of possible necklace (G68, Somerset Museum) from Meare Lake Village East in Somerset.
- Figure 166: Scatter-graphs comparing the dimensions of beads found in the same mound context at Meare Lake Village in Somerset. (a) Necklace G68 from MLVE Mound 22; (b) Necklace G69 from MLVE Mound 47; (c) MLVW Mound 7; (d) MLVW Mound 33.
- Figure 166: Scatter-graphs comparing the dimensions of beads found in the same mound context at Meare Lake Village in Somerset. (e) MLVW Mound 34.
- Figure 167: Proposed typologies: (a) Pins, (b) Wrist/Arm/Ankle Rings, (c) Finger- and Toe-rings, (d) Torcs.
- Figure 168: Bar-charts comparing the frequency of different types of artefacts in each study region: (a) Frequency, (b) Percentage.
- Figure 169: General frequency of brooches throughout the Iron Age using data from all study regions.
- Figure 170: Bar-charts comparing the frequency of brooches by date: (a) Frequency; (b) Percentage.
- Figure 171: Bar-chart comparing the frequency of different torc types using data from all study regions.
- Figure 172: Bar-charts comparing the frequency of different torc types by study regions: (a) Frequency; (b) Percentage.
- Figure 173: Bar-chart showing general frequency of different types of objects worn on either the wrist, arm, or ankle. Dark grey are types made mostly out of metal, usually iron or copper alloy, medium grey are two types of glass rings, and lightest grey
- Figure 174: Bar-charts comparing the frequency of different types of rings worn on the wrist, arm, and ankle by study region: (a) Frequency, (b) Percentage.
- Figure 175: Bar-chart comparing the frequency of different types of finger- and toe-rings using data from all study regions.
- Figure 176: Bar-charts comparing the frequency of finger- and toe-rings in each of the study regions. (a) Frequency.
- Figure 176: Bar-charts comparing the frequency of finger- and toe-rings in each of the study regions, (b) Percentage.
- Figure 177: Bar-chart showing the frequency of different types of pins using data from all study regions.
- Figure 178: Bar-charts comparing the frequency of different pin types by study region: (a) Frequency.
- Figure 178: Bar-charts comparing the frequency of different pin types by study region: (b) Percentage.
- Discussion-5
- Figure 179: Bar-charts showing the frequency of objects in study regions over time: (a) All Objects, (b) Arm/Wrist/Ankle rings.
- Figure 179: Bar-charts showing the frequency of objects in study regions over time: (c) Finger-/Toe-rings, (d) Pins.
- Figure 179: Bar-charts showing the frequency of objects in study regions over time: (e) Torcs, (f) Brooches.
- Figure 180: Map showing the density of all beads from database including Guido catalogue. Yellow = low density, red = high density.
- Figure 181: Comparison of the distribution of different Iron Age artefacts from Portable Antiquity Scheme data. (a) Brooches, (b) Coins. Yellow = low density, red = high density.
- Figure 181: Comparison of the distribution of different Iron Age artefacts from Portable Antiquity Scheme data. (c) Cosmetic Objects, (d) Horse related gear. Yellow = low density, red = high density.
- Conclusion-6
- Chapter_9_Glass_beads_in_their
- Chapter 9 Glass Beads in their Social Context
- Appendix A Terminology & Guide to Recording Glass Beads
- Figure 182: Bead measurements of round and non-round beads.
- Figure 183: Illustration of different bead shapes.
- Figure 184: Bead shapes as determined by ratio used throughout book.
- Figure 185: Identified decorative motifs.
- Figure 186: Example of bead colour terminology on polychrome beads with dot and linear decorative motifs.
- Figure 187: Diagram of motif placement on the beads. (a) single circumferential, (b) single alternating, (c) paired circumferential, (d) pairs and single circumferential.
- Figure 188: Description of bead decoration terminology.
- Appendix B Guido Iron Age Glass Bead Types
- Appendix C List of All New Types
- Guide to the Illustrated Glass Beads
- Figure 189: Examples of Class 1, 2, and 3 beads.
- Figure 190: Examples of Class 4 and 5 beads.
- Figure 191: Examples of Class 6 beads.
- Figure 192: Examples of Class 7, 8, 9, and 10 beads.
- Figure 193: Examples of Class 11 beads.
- Figure 194: Examples of Class 11 and un-typed beads.
- Bibliography
- Index
Frequently asked questions
Yes, you can cancel anytime from the Subscription tab in your account settings on the Perlego website. Your subscription will stay active until the end of your current billing period. Learn how to cancel your subscription
No, books cannot be downloaded as external files, such as PDFs, for use outside of Perlego. However, you can download books within the Perlego app for offline reading on mobile or tablet. Learn how to download books offline
Perlego offers two plans: Essential and Complete
- Essential is ideal for learners and professionals who enjoy exploring a wide range of subjects. Access the Essential Library with 800,000+ trusted titles and best-sellers across business, personal growth, and the humanities. Includes unlimited reading time and Standard Read Aloud voice.
- Complete: Perfect for advanced learners and researchers needing full, unrestricted access. Unlock 1.5M+ books across hundreds of subjects, including academic and specialized titles. The Complete Plan also includes advanced features like Premium Read Aloud and Research Assistant.
We are an online textbook subscription service, where you can get access to an entire online library for less than the price of a single book per month. With over 1.5 million books across 990+ topics, we’ve got you covered! Learn about our mission
Look out for the read-aloud symbol on your next book to see if you can listen to it. The read-aloud tool reads text aloud for you, highlighting the text as it is being read. You can pause it, speed it up and slow it down. Learn more about Read Aloud
Yes! You can use the Perlego app on both iOS and Android devices to read anytime, anywhere — even offline. Perfect for commutes or when you’re on the go.
Please note we cannot support devices running on iOS 13 and Android 7 or earlier. Learn more about using the app
Please note we cannot support devices running on iOS 13 and Android 7 or earlier. Learn more about using the app
Yes, you can access Dress and Identity in Iron Age Britain by Elizabeth Marie Foulds in PDF and/or ePUB format, as well as other popular books in Social Sciences & Archaeology. We have over 1.5 million books available in our catalogue for you to explore.