![]()
PART 1
Bring Back the Bureaucrats
![]()
CHAPTER 1
Leviathan by Proxy
EVERYONE KNOWS that America’s federal government has grown bigger and bigger over the last half-century. In 2013, Washington spent more than $3.5 trillion. Adjusted for inflation, that was five times more than it spent in 1960. Indeed, the roughly $6 trillion in federal budget deficits that Washington amassed from 2009 to 2013 exceeded total federal spending for the period 1960 through 1966. While annual federal budget deficits are now projected to average “only” about $500 billion a year from 2014 through 2018, Washington’s financial problems remain far from solved. For instance, Medicare, the federal health insurance program that covers most senior citizens, has an unfunded, long-term liability of about $40 trillion.1
Still, the big story about big government that matters most to America’s future is not all about Washington’s finances. It’s not captured by the usual partisan and ideological debates. And it’s dimly perceived and barely understood even by most academics who make their living by studying American government and public policy.
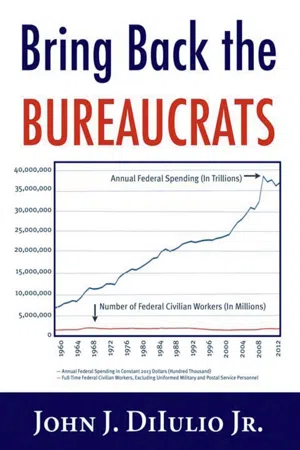
The really big story about big government in America can be glimpsed by eyeballing the figure that appears on this book’s cover.2 In constant 2013 dollars, annual federal government spending doubled between 1960 and 1975. It then doubled again between 1975 and 2005. This expansion in federal spending was accompanied by an expansion of the federal bureaucracy. Since 1965, six new federal cabinet agencies have been established (including, most recently, the Department of Homeland Security in 2002), many new sub-cabinet agencies have been created (for example, the Environmental Protection Agency in 1970), and the total number of pages in the Federal Register, which catalogues federal government policies, programs, and regulations, has increased about fourfold (to more than 80,000 pages).
And yet, during the same half-century that federal government spending increased fivefold, the number of federal bureaucrats increased hardly at all.
In fact, during several post-1960 periods when federal spending spiked and new federal cabinet departments and agencies launched, the number of full-time federal civil servants, excluding uniformed military personnel and postal workers, actually decreased.
When George W. Bush won the presidency in 2000, as when John F. Kennedy won it in 1960, the executive branch employed about 1.8 million full-time civilian workers. And when Ronald Reagan won reelection in 1984, there were slightly more federal bureaucrats (about 2.2 million) than when Barack Obama won reelection in 2012 (about 2 million).
Using constant 2013 dollars, in 1960, the federal government spent about $726 billion and employed about 1.8 million full-time federal bureaucrats; in 1975, the federal government spent about $1.4 trillion and employed 2.1 million full-time bureaucrats. Thus, between 1960 and 1975, Washington’s annual spending increased by about 200 percent, but its full-time workforce increased by less than 20 percent. By 2005, Washington spent around $2.9 trillion, which was about four times as much as it spent in 1960. But in 2005, as in 1960, there were about 1.8 million full-time federal civilian bureaucrats: federal spending was about four times larger, but the federal workforce was about the same size. Indeed, the full-time federal civilian workforce was actually smaller in 2013 than it was in twenty-six of the fifity-three years since 1960.
Washington now spends billions of dollars a year on home-land security, housing, environmental protection, elementary education, child welfare services, health care, urban transportation, and much more. Today’s federal government has laws, policies, programs, bureaucracies, and regulations on numerous matters that were not on the federal agenda (or were barely on it) when Dwight D. Eisenhower was president. Even though it now leaves no area of American life untouched, the federal government with its multitrillion-dollar annual budget has roughly the same number of full-time federal bureaucrats today as it had when Ike left office.
But how?
“Big government” in America is a Washington-led big intergovernment by proxy. This fundamental truth about how big government in America really works has been hiding in plain view for decades. Big intergovernment’s proxies are state and local governments, for-profit businesses, and nonprofit organizations.
State and Local Government Proxies
•More than two dozen federal departments and agencies spend a combined total of more than $600 billion a year on more than 200 intergovernmental grant programs for state and local governments.3
•Adjusted for inflation, between 1960 and 2012, federal grants-in-aid to states increased more than tenfold.4
•Over the last half-century, while the federal civilian workforce remained around 2 million full-time bureaucrats, the total number of state and local government employees roughly tripled to more than 18 million.
•In 2011, there were 14.8 million full-time and 4.8 million part-time workers employed by state and local governments.5
•The single largest budget item in most state budgets is Medicaid, a means-tested federal-state program that pays the medical expenses of persons receiving federal welfare or supplemental security income payments. In 2011, Washington spent about $275 billion and states spent about $157 billion on Medicaid; the federal government paid at least half of the states’ administrative costs for Medicaid.6
For-Profit Business Proxies
•The federal government spends more than $500 billion a year on contracts with for-profit firms.7 Many for-profit firms, from small businesses to huge corporations, have the federal government as a major or sole customer.
•In 2012, the Department of Defense (DOD) obligated roughly $350 billion to contractors. The DOD had about 800,000 DOD civilian workers plus the equivalent of some 710,000 full-time contract employees.8
•The federal government’s DOD-anchored military-industrial complex is a first cousin to its entitlement-industrial complex involving both for-profit and nonprofit proxies.
•With more than 300 different federal programs, the Department of Health and Human Services is not only the single largest federal grant-making agency (81,000 grants totaling nearly $350 billion in 2012), but it is the third largest federal contracting agency ($19 billion in contracts in 2013).9
•All told, in 2012, businesses that received federal contracts employed an estimated 22 percent of the U.S. workforce, or about 26 million workers.10
•From Superfund to Social Security, from child welfare services to nuclear safety services, there is virtually no federal government domestic policy, program, or regulation that is untouched by for-profit contractors.
Nonprofit Organization Proxies
•The nonprofit sector encompasses about 1.6 million organizations registered with the Internal Revenue Service plus many thousands more tax-exempt organizations that are not required to register and opt not to do so.
•The subset of nonprofit organizations that filed reports with the IRS (about 40 percent of all registered nonprofits) has about $2 trillion in annual revenues, and roughly a third of the money comes from government grants plus fees for services and goods from government sources.11
•In 2012, governments entered into about 350,000 contracts and grants with about 56,000 nonprofit organizations (an average of six contracts/grants per nonprofit organization) and paid $137 billion to nonprofit organizations for services.12
•Billions of dollars in federal “pass-through grants” flow from Washington through state capitals and into the coffers of local governments and nonprofit organizations. In 2012, Washington supplied nearly $80 billion in such grants.13
•In 2010, the nonprofit sector employed about 10.7 percent of the U.S. workforce, or nearly 11 million people—the nation’s third largest workforce behind only retail trade and manufacturing.14
•In addition to receiving government grants and fees, many nonprofit organizations own tax-exempt properties, receive tax-deductible donations, and have beneficiaries or clients who receive tax-funded payments, subsidies, or loans with which to “purchase” the nonprofit organization’s goods or services.15
•In the late 1990s and early 2000s, my own fairly well-known case for federal “faith-based initiatives” and “leveling the playing field” was essentially about ensuring that urban congregations and small, community-serving religious nonprofit groups were eligible for federal and intergovernmental grants or contracts on the same basis as other nonprofit organizations, both religious and secular, that had long received such grants and contracts.16
Not without good reason, the rise of “big government” is commonly discussed in relation to record public spending and public debt. In recent years, federal government spending has averaged about 24 percent of gross domestic product (GDP)17 and combined state and local government spending has averaged around 16 percent of GDP.18 After reaching 27 percent in 1960, total government spending (federal plus state and local) in the United States as a percentage of GDP remained in the thirties in most years from 1980 through the mid-2000s, but it increased to 42 percent in 2009, and by the early 2010s, it hovered around 40 percent.19
At roughly 40 percent, America’s government spending to GDP ratio rivals that of many European democracies. Indeed, adjusted for cross-national differences in health insurance accounting practices, it has been estimated that total government spending in the United States as a percentage of GDP (46.8 percent) is just a couple points below the average for the seventeen so-called Euro Area democracies (49.3 percent).20
By the same token, federal government debt per capita is about $53,000, and total government spending (federal, state, and local) per capita is about $19,000—a total of more than $70,000 a year in government finances for each man, woman, and child in the country.21 In recent years, both America’s per capita government spending and its debt-to-GDP ratio were actually higher than those of many European democracies.22
Thus, America’s big government does not spend or borrow significantly less than all the supposedly more “statist” European democracies do. Rather, what is most distinctive about big government or “the state” in America is not how much it spends or borrows, but how the nation’s policies, programs, and regulations are administered.
Most European democracies restrict “outsourcing” far more than the United States does. For example, German law dictates that all persons involved in administering national policies must be directly supervised by a government official, and in France, the United Kingdom, and most other European democracies, there are either constitutional, statutory, or customary limits that favor direct public administration. The same is true for Japan and many other non-European democracies.
Uniquely, big government in America is Leviathan by Proxy. Following are just a few brief examples:
•The Patient Protection and Affordable Care Act of 2010, also known as the ACA or Obamacare, is a big-government program that uses contractors by the dozens (including both for-profit firms and nonprofit organizations) that have been paid by the U.S. Department of Health and Human Services or the U.S. Department of the Treasury to build information technology systems, help consumers navigate the health exchange marketplaces, and more.23 As the Health and Human Services Office of the Inspector General has noted, “Contractors have played, and will continue to play, a vital role in building, maintaining, and fixing the computer systems that underpin the implementation” of the ACA and its health “exchanges.”24
•At one point the Department of Homeland Security had more private contract employees (about 200,000) than federal employees (about 188...