eBook - ePub
Visualizing Social Science Research
Maps, Methods, & Meaning
- 224 pages
- English
- ePUB (mobile friendly)
- Available on iOS & Android
eBook - ePub
About this book
This introductory text presents basic principles of social science research through maps, graphs, and diagrams. The authors show how concept maps and mind maps can be used in quantitative, qualitative, and mixed methods research, using student-friendly examples and classroom-based activities. Integrating theory and practice, chapters show how to use these tools to plan research projects, "see" analysis strategies, and assist in the development and writing of research reports.
Trusted by 375,005 students
Access to over 1 million titles for a fair monthly price.
Study more efficiently using our study tools.
Information
1
Visualizing Social Science Research
CHAPTER OVERVIEW AND OBJECTIVES
Visualizing social science research refers to the techniques, processes, and tools that allow students, instructors, and investigators to understand, present, and frame research. This includes a variety of maps, graphs, and diagrams used to illuminate processes that may otherwise appear complex and daunting. Visualizing research need not be limited to the presentation of findings. In this book, we explore the potential of graphic illustrations to demystify and clarify designs, collect data, present methods, and explore measurement.
This chapter introduces the research process including major theoretical perspectives, epistemological concerns, and methodological and data-collection choices. A central theme in this chapter is that the assumptions made by different researchers and the resultant approaches inform and influence the research process. By graphically presenting examples of deductive, inductive, and abductive approaches in quantitative, qualitative, and mixed-measures research, this chapter uses visual examples to present an overview of major theoretical approaches to social science research. Finally, this chapter shows how maps can help frame a research project and how they can assist novice researchers when considering the various steps involved in conducting a research project. Through a sample research problem, readers will be encouraged to use maps, graphs, or diagrams to plan a research project. By the end of this chapter, readers should be able to
- define social science research and explain why visualizing the processes involved can be useful;
- understand the steps involved in completing a research project;
- consider how visualizing research can assist students, instructors, and researchers;
- describe how different theoretical starting points influence the research approach taken; and
- explain why it is useful to acknowledge that all research is a series of decisions.
WHY VISUALIZE SOCIAL SCIENCE RESEARCH?
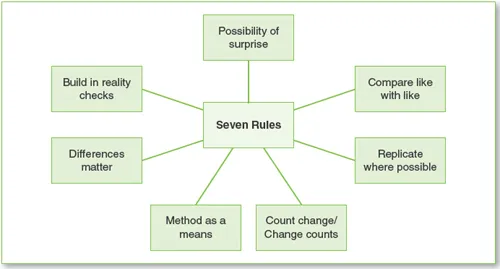
Social science research seeks to understand, explain, and predict human behavior by observing, reflecting, and/or measuring social phenomena. As a branch of science, it focuses on the study of society and the relationships of individuals by exploring meaning from a human perspective and testing and/or constructing theories based on these investigations. Glenn Firebaugh (2008) summarized seven principles for good social science research (see Figure 1.1). The first six are the possibility of surprise, the need to explore differences within your research, the need to compare findings from one group with findings from another, and the need to focus on how, why, and to what extent things change.
Firebaugh (2008) concluded his discussion with an important final rule. Methods must always be the means—never the end—of social science research. Methods serve the needs of the research, the sample to be studied, and the question (s) to be explored. This may be because all research can be seen as a series of “research decisions” (Palys, 1992). Seeing research as a series of decisions acknowledges that different research problems, data-collection strategies, and methods of analysis shape research findings. All decisions have consequences; it is important to remain humble about the fact that no matter how good the research is, all honest research acknowledges its limitations. Whereas for some, the notion that research cannot provide the answer may be disconcerting, when properly planned, conducted, and presented, social science research nevertheless offers us the best means with which to make sense of the world.
Figure 1.1 Seven Rules for Social Science Research
This book begins with the assumption that new approaches to research methods are needed to attract students and young researchers into the social sciences in the first place. The tools we explore throughout the book provide a means to channel creativity and investigate how research can assist people to better understand both our world and ourselves (Mintzes, Wandersee, & Novak, 1998). Although images increasingly play an important role in our daily lives, their potential to teach students and to assess learning outcomes have not yet been fully integrated into the social sciences. This may be because we are emerging from an era in which standardized tests were seen as the only means to assess learning, based on a well-intentioned but incomplete one-size-fits-all approach to education. Emergent approaches seek to build teacher education, learning assessments, and measurements of student outcomes by focusing on responsibility and accountability (Shavelson, 2010); however, questions remain about how new integrated assessment systems can be operationalized and incorporated into existing curricula.
One strategy is to view developing social science research pedagogy as not only a means to an end but an end in and of itself. By reading and doing the exercises in this book, the student will become part of a new way of learning through visual and graphic means. Expanding on cognitive approaches to education, in this text we take seriously the need for students to know, understand, integrate, and reflect on what they are learning. In this book we attempt to do this by offering overviews, contemplating debates, and providing examples in ways designed to build critical thinking, research, and reasoning skills among a new generation of college students. To succeed, we think it is time to revisit how research has traditionally been taught. There is evidence that traditional education models have been more successful at ensuring students can recite facts from the past than facilitating the kind of practical skill development and higher order thinking that can enable them to both discover and use knowledge in the future (Blagg, 1991). As Richard LeGates (2004) has noted, undergraduate students who are beginning majors in the social sciences feel inadequate when undertaking rigorous empirical social science research. Unlike their peers in the natural sciences, social science students all too often fear and rarely enjoy research methods courses. Subjecting students to research methods courses they do not enjoy poses motivation and retention problems. It also poses a significant challenge for a new generation of instructors who seek to combine standards with accessibility.
In this text we hope to build on other attempts to demystify the research process (Alvarez & Gowin, 2009) and expand emergent discussions about the use and utility of visual methods (Banks, 2001). Our approach is based on the promotion of practical social science research by making the college classroom a laboratory—a place where research is discussed, conducted, and visualized by instructors and students working together. The notion that visualizing social science research can assist students, instructors, and researchers to see patterns is by no means new (Kaplan, 1964). Yet despite promising developments since the 1970s, visual depictions of exploratory data analysis are only now reemerging, driven in some ways by the wealth of data available to all online. Yet this remains an area of scholarship in which chaos reigns (Åhlberg, 2008) and too few authors acknowledge the shoulders of those on whom they stand. Although we too have likely missed some past visual approaches, we believe there is value in providing a variety of examples. Some predecessors to current mapping efforts include “spider diagrams” (Hanf, 1971), “mind maps” (Buzan, 1974), “box and whisker” charts and “stem-and-leaf “diagrams (Tukey, 1977), “knowledge mapping” (Dansereau, Sells, & Simpson, 1979), “Vee diagrams” (Gowin, 1981), “concept maps” (Novak, 1981), and “clustering” (Rico, 1983).
Despite the wide variety of depictions, visual representations in research are too often limited to the presentation of data and the explanation of findings. A leading expert on the visual display of quantitative information is Edward Tufte. He has written a number of books in his distinguished career, but Tufte is perhaps best known for his detailed analysis of how to display data for precise, effective, quick analysis presented in his seminal book The Visual Display of Quantitative Research, first published in 1983. He argued that graphics play an important role in the understanding and interpretation of statistical findings. In the most recent edition of his famous text he wrote the following:
What is to be sought in designs for the display of information is the clear portrayal of complexity. Not the complication of the simple; rather the task of the designer is to give visual access to the subtle and difficult—that is, the revelation of the complex. (Tufte, 2001, p. 191).
As visualization has been used as part of scientific reasoning, it is often seen as merely another analytical tool for sense making (Viégas & Wattenberg, 2009). In recent years, the availability of online data sources has led to a number of new means to engage in information visualization. These include free online programs such as Many Eyes, Phrase Nets, and Wordle (Feinberg, 2010)—which we have used in this book (van Ham, Wattenberg, & Viégas, 2009; Viégas & Wattenberg, 2009; Viégas, Wattenberg, van Ham, Kriss, & McKeon, 2007). Providing a more accessible means to visualize quantified online data is laudable, but there may be other ways, approaches, and purposes that should be considered. As Johanna Drucker (2009) has noted, for some researchers it is imperative to develop models of knowledge for the digital age that provide a means to capture data that are freely “given” by participants rather than focus solely on presenting data “taken” by researchers.
Although differences among approaches exist, a good starting place is the idea that the bulk of what a researcher does is an attempt to derive meaning from data, requiring the recognition of patterns (Miles & Huberman, 1994). Graphic knowledge representation tools can be especially useful in illuminating this process. This book focuses on concept maps, mind maps, and Vee heuristic diagrams to provide a “window on the mind” (Shavelson, Ruiz-Primo, & Wiley, 2005). We present maps as a distinctive means with which to gather data and facilitate a deeper appreciation of the research process, with the goal of improving teaching, learning, and overall understanding (Entwistle, 2009). To understand the value and potential of maps in social science research, it is important to first appreciate the different aspects of the research process itself.
UNDERSTANDING THE RESEARCH PROCESS
Unlike natural science research, social science research attempts to measure what some consider intangibles. These include perceptions, behaviors, emotions, and/or personalities. It is important to understand that whereas approaches to social science research vary by discipl...
Table of contents
- Cover Page
- Dedication
- Title Page
- Copyright
- Contents
- Preface
- Acknowledgments
- Abouttheauthors
- Chapter 1. Visualizing Social Science Research
- Chapter 2. Concept Maps and Mind Maps: Theory, Definitions, and Approaches
- Chapter 3. Scoring and Statistics: Using Concept Maps in Quantitative Social Science Research
- Chapter 4. From the Ground Up: Using Mind Maps in Qualitative Research
- Chapter 5. Mapping Mixed-Methods Research: Theories, Models, and Measures
- Chapter 6. Putting it all Together: Using Maps and Diagrams to Organize, Write, and Reflect on Research
- Chapter 7. Maps, Limitations, and Considerations: New Directions in Social Science Research
- Appendix A: Example Research Participant Protection Form Checklist
- Appendix B: Example of Informed Consent Form
- Index
Frequently asked questions
Yes, you can cancel anytime from the Subscription tab in your account settings on the Perlego website. Your subscription will stay active until the end of your current billing period. Learn how to cancel your subscription
No, books cannot be downloaded as external files, such as PDFs, for use outside of Perlego. However, you can download books within the Perlego app for offline reading on mobile or tablet. Learn how to download books offline
Perlego offers two plans: Essential and Complete
- Essential is ideal for learners and professionals who enjoy exploring a wide range of subjects. Access the Essential Library with 800,000+ trusted titles and best-sellers across business, personal growth, and the humanities. Includes unlimited reading time and Standard Read Aloud voice.
- Complete: Perfect for advanced learners and researchers needing full, unrestricted access. Unlock 1.4M+ books across hundreds of subjects, including academic and specialized titles. The Complete Plan also includes advanced features like Premium Read Aloud and Research Assistant.
We are an online textbook subscription service, where you can get access to an entire online library for less than the price of a single book per month. With over 1 million books across 990+ topics, we’ve got you covered! Learn about our mission
Look out for the read-aloud symbol on your next book to see if you can listen to it. The read-aloud tool reads text aloud for you, highlighting the text as it is being read. You can pause it, speed it up and slow it down. Learn more about Read Aloud
Yes! You can use the Perlego app on both iOS and Android devices to read anytime, anywhere — even offline. Perfect for commutes or when you’re on the go.
Please note we cannot support devices running on iOS 13 and Android 7 or earlier. Learn more about using the app
Please note we cannot support devices running on iOS 13 and Android 7 or earlier. Learn more about using the app
Yes, you can access Visualizing Social Science Research by Johannes Wheeldon,Mauri K. Ahlberg in PDF and/or ePUB format, as well as other popular books in Social Sciences & Social Science Research & Methodology. We have over one million books available in our catalogue for you to explore.