Pandas in Action
eBook - ePub

Pandas in Action

Boris Paskhaver

Share book
  1. 440 pages
  2. English
  3. ePUB (mobile friendly)
  4. Available on iOS & Android
eBook - ePub

Pandas in Action

Boris Paskhaver

Book details
Book preview
Table of contents
Citations

About This Book

Take the next steps in your data science career! This friendly and hands-on guide shows you how to start mastering Pandas with skills you already know from spreadsheet software. In Pandas in Action you will learn how to: Import datasets, identify issues with their data structures, and optimize them for efficiency
Sort, filter, pivot, and draw conclusions from a dataset and its subsets
Identify trends from text-based and time-based data
Organize, group, merge, and join separate datasets
Use a GroupBy object to store multiple DataFrames Pandas has rapidly become one of Python's most popular data analysis libraries. In Pandas in Action, a friendly and example-rich introduction, author Boris Paskhaver shows you how to master this versatile tool and take the next steps in your data science career. You'll learn how easy Pandas makes it to efficiently sort, analyze, filter and munge almost any type of data. Purchase of the print book includes a free eBook in PDF, Kindle, and ePub formats from Manning Publications. About the technology
Data analysis with Python doesn't have to be hard. If you can use a spreadsheet, you can learn pandas! While its grid-style layouts may remind you of Excel, pandas is far more flexible and powerful. This Python library quickly performs operations on millions of rows, and it interfaces easily with other tools in the Python data ecosystem. It's a perfect way to up your data game. About the book
Pandas in Action introduces Python-based data analysis using the amazing pandas library. You'll learn to automate repetitive operations and gain deeper insights into your data that would be impractical—or impossible—in Excel. Each chapter is a self-contained tutorial. Realistic downloadable datasets help you learn from the kind of messy data you'll find in the real world. What's inside Organize, group, merge, split, and join datasets
Find trends in text-based and time-based data
Sort, filter, pivot, optimize, and draw conclusions
Apply aggregate operationsAbout the reader
For readers experienced with spreadsheets and basic Python programming. About the author
Boris Paskhaver is a software engineer, Agile consultant, and online educator. His programming courses have been taken by 300, 000 students across 190 countries. Table of Contents
PART 1 CORE PANDAS
1 Introducing pandas
2 The Series object
3 Series methods
4 The DataFrame object
5 Filtering a DataFrame
PART 2 APPLIED PANDAS
6 Working with text data
7 MultiIndex DataFrames
8 Reshaping and pivoting
9 The GroupBy object
10 Merging, joining, and concatenating
11 Working with dates and times
12 Imports and exports
13 Configuring pandas
14 Visualization

Frequently asked questions

How do I cancel my subscription?
Simply head over to the account section in settings and click on “Cancel Subscription” - it’s as simple as that. After you cancel, your membership will stay active for the remainder of the time you’ve paid for. Learn more here.
Can/how do I download books?
At the moment all of our mobile-responsive ePub books are available to download via the app. Most of our PDFs are also available to download and we're working on making the final remaining ones downloadable now. Learn more here.
What is the difference between the pricing plans?
Both plans give you full access to the library and all of Perlego’s features. The only differences are the price and subscription period: With the annual plan you’ll save around 30% compared to 12 months on the monthly plan.
What is Perlego?
We are an online textbook subscription service, where you can get access to an entire online library for less than the price of a single book per month. With over 1 million books across 1000+ topics, we’ve got you covered! Learn more here.
Do you support text-to-speech?
Look out for the read-aloud symbol on your next book to see if you can listen to it. The read-aloud tool reads text aloud for you, highlighting the text as it is being read. You can pause it, speed it up and slow it down. Learn more here.
Is Pandas in Action an online PDF/ePUB?
Yes, you can access Pandas in Action by Boris Paskhaver in PDF and/or ePUB format, as well as other popular books in Computer Science & Data Processing. We have over one million books available in our catalogue for you to explore.

Information

Publisher
Manning
Year
2021
ISBN
9781638351047

Part 1. Core pandas

Welcome! In this section, we’ll familiarize ourselves with the core mechanics of pandas and its two primary data structures: the one-dimensional Series and the two-dimensional DataFrame. Chapter 1 begins with an analysis of a data set with pandas so you can immediately get a sense of what is possible with the library. From there, we proceed to an in-depth exploration of the Series in chapters 2 and 3. We learn how to create a Series from scratch; import it from an external data set; and apply a slew of mathematical, statistical, and logical operations to it. In chapter 4, we introduce the tabular DataFrame and various ways to extract rows, columns, and values from its data. Finally, chapter 5 focuses on extracting subsets of DataFrame rows by applying logical criteria. Along the way, we’ll work through eight datasets that cover everything from box-office grosses to NBA players to PokĂ©mon.
This part covers the essentials of pandas, the fundamentals you need to know to work effectively with the library. I’ve made every effort to start from square one, from the smallest building blocks possible, and proceed to the larger and more complex elements. The following five chapters build the foundation for your mastery of pandas. Good luck!

1 Introducing pandas

This chapter covers
  • The growth of data science in the 21st century
  • The history of the pandas library for data analysis
  • The pros and cons of pandas and its competitors
  • Data analysis in Excel versus data analysis with a programming language
  • A tour of the library’s features through a working example
Welcome to Pandas in Action! Pandas is a library for data analysis built on top of the Python programming language. A library (also called a package) is a collection of code for solving problems in a specific field of endeavor. Pandas is a toolbox for data manipulation operations: sorting, filtering, cleaning, deduping, aggregating, pivoting, and more. The epicenter of Python’s vast data science ecosystem, pandas pairs well with other libraries for statistics, natural language processing, machine learning, data visualization, and more.
In this introductory chapter, we’ll explore the history and evolution of modern data analytics tools. We’ll see how pandas grew from one financial analyst’s pet project to an industry standard used by companies such as Stripe, Google, and J.P. Morgan. We’ll compare the library with its competitors, including Excel and R. We’ll discuss the differences between working with a programming language and working with a graphical spreadsheet application. Finally, we’ll use pandas to analyze a real-world data set. Consider this chapter to be a sneak preview of the concepts you’ll master throughout the book. Let’s dive in!

1.1 Data in the 21st century

“It is a capital mistake to theorize before one has data,” Sherlock Holmes advises his assistant John Watson in “A Scandal in Bohemia,” the first of Sir Arthur Conan Doyle’s classic short stories pairing the duo. “Insensibly one begins to twist facts to suit theories, instead of theories to suit facts.”
The wise detective’s words continue to ring true more than a century after the publication of Doyle’s work, in a world in which data is becoming increasingly prevalent in every facet of our lives. “The world’s most valuable resource is no longer oil, but data,” declared The Economist in a 2017 opinion piece. Data is evidence, and evidence is critical to businesses, governments, institutions, and individuals solving increasingly complex problems in our interconnected world. Across a breadth of industries, the world’s most successful companies, from Facebook to Amazon to Netflix, cite data as the most prized asset in their portfolios. United Nations Secretary-General António Guterres called accurate data “the lifeblood of good policy and decision-making.” Data powers everything from movie recommendations to medical treatments, from supply chain logistics to poverty-reduction initiatives. The success of communities, companies, and even countries in the 21st century will depend on their ability to acquire, aggregate, and analyze data.

1.2 Introducing pandas

The technological ecosystem of tools for working with data has grown tremendously over the past decade. Today, the open source pandas library is one of the most popular solutions available for data analysis and manipulation. Open source means that the library’s source code is publicly available to download, use, modify, and distribute. Its license grants users more permissions than proprietary software such as Excel. Pandas is free to use. A global team of volunteer software developers maintains the library, and you can find its complete source code on GitHub (https://github.com/pandas-dev/pandas).
Pandas is comparable to Microsoft’s Excel spreadsheet software and Google’s in-browser Sheets application. In all three technologies, a user interacts with tables consisting of rows and columns of data. A row represents a record or, equivalently, one collection of values for the columns. Transformations are applied to coax the data into the desired state.
Figure 1.1 displays a sample transformation of a data set. The analyst applies an operation to the four-row data set on the left to arrive at the two-row data set on the right. They may select rows that fit a criterion, for example, or remove duplicate rows from the original data set.
Figure 1.1 A sample transformation of a tabular data set
What makes pandas unique is the balance it strikes between processing power and user productivity. By relying on lower-level languages such as C for many of its calculations, the library can efficiently transform million-row data sets in milliseconds. At the same time, it maintains a simple and intuitive set of commands. It is easy to accomplish a lot with a little code in pandas.
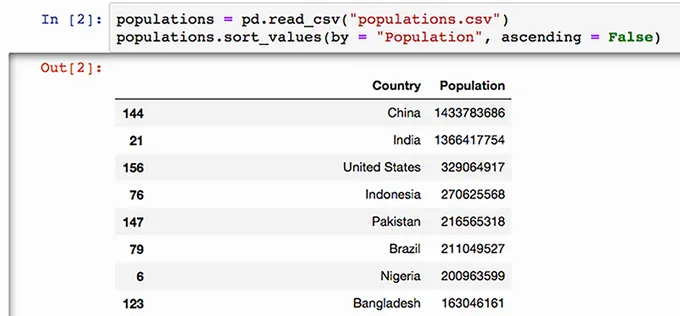
Figure 1.2 shows some sample pandas code that imports and sorts a CSV data set. Don’t worry about the code yet, but take a second to notice that the entire operation takes only two lines of code.
Figure 1.2 A sample of code that imports and sorts a data set in pandas
Pandas works seamlessly with numbers, text, dates, times, missing data, and more. We’ll explore its incredible versatility as we proceed through the more than 30 data sets included with this book.
The first version of pandas was developed in 2008 by software developer Wes McKinney, who was working at New York’s AQR Capital Management investment firm. Dissatisfied with both Excel and the statistical programming language R, McKinney searched for a tool that would make it easy to solve common data problems in the financial industry, particularly cleanup and aggregation. Unable to find an ideal product, he decided to build one himself. At the time, Python was f...

Table of contents