Learn how to gain insights from your data as well as machine learning and become a presentation pro who can create interactive dashboards
Key Features
Enhance your presentation skills by implementing engaging data storytelling and visualization techniques
Learn the basics of machine learning and easily apply machine learning models to your data
Improve productivity by automating your data processes
Book Description
Data Analytics Made Easy is an accessible beginner's guide for anyone working with data. The book interweaves four key elements:
Data visualizations and storytelling – Tired of people not listening to you and ignoring your results? Don't worry; chapters 7 and 8 show you how to enhance your presentations and engage with your managers and co-workers. Learn to create focused content with a well-structured story behind it to captivate your audience.
Automating your data workflows – Improve your productivity by automating your data analysis. This book introduces you to the open-source platform, KNIME Analytics Platform. You'll see how to use this no-code and free-to-use software to create a KNIME workflow of your data processes just by clicking and dragging components.
Machine learning – Data Analytics Made Easy describes popular machine learning approaches in a simplified and visual way before implementing these machine learning models using KNIME. You'll not only be able to understand data scientists' machine learning models; you'll be able to challenge them and build your own.
Creating interactive dashboards – Follow the book's simple methodology to create professional-looking dashboards using Microsoft Power BI, giving users the capability to slice and dice data and drill down into the results.
What you will learn
Understand the potential of data and its impact on your business
Import, clean, transform, combine data feeds, and automate your processes
Influence business decisions by learning to create engaging presentations
Build real-world models to improve profitability, create customer segmentation, automate and improve data reporting, and more
Create professional-looking and business-centric visuals and dashboards
Open the lid on the black box of AI and learn about and implement supervised and unsupervised machine learning models
Who this book is for
This book is for beginners who work with data and those who need to know how to interpret their business/customer data. The book also covers the high-level concepts of data workflows, machine learning, data storytelling, and visualizations, which are useful for managers.
No previous math, statistics, or computer science knowledge is required.
Trusted by 375,005 students
Access to over 1.5 million titles for a fair monthly price.
You've heard a lot about creating business value with intelligent algorithms: it's finally time to roll up our sleeves and make it happen. In this chapter, we are going to experience what it means to apply machine learning to tangible cases by going through a few step-by-step tutorials. Our companion KNIME is back on stage: we will learn how to build workflows for implementing machine learning models using real-world data. We are going to meet a few specific algorithms and learn the intuitive mechanisms behind how they operate. We'll glimpse into their underlying mathematical models, focusing on the basics to comprehend their results and leverage them in our work.
This practical chapter will answer several questions, including:
How do I make predictions using supervised machine learning algorithms in KNIME?
How can I check whether a model is performing well?
How do we avoid the risk of overfitting?
What techniques can I use to improve the performance of a model?
How can I group similar elements together using clustering algorithms?
The tutorials included in this chapter cover three of the most recurrent cases when you can rely on machine learning as part of your work: predicting numbers, classifying entities, and grouping elements. Think of them as "templates" that you can widely reapply after you reach the last page of the chapter and that you are likely to keep using as a reference. The steps of the tutorials are also organized in the same order they would unfold in everyday practice, including the "back and forth" iterations required for improving the performance of your model. This will prepare you to face the actual use of real-life machine learning, which often follows a circuitous route made of trial and error attempts.
Within each tutorial, you will encounter one or two machine learning algorithms (specifically, linear regression in the first, decision tree and random forest in the second, and k-means in the third) that will be introduced and explained before being seen in action. Let's get started with some first predictions!
Predicting numbers through regressions
For this tutorial, you will assume the—somewhat—enviable role of a real estate agent based in Rome, Italy. The company you work for owns multiple agencies specialized in rentals of properties located in the broader metropolitan area of the Eternal City. Your passion for data analytics got you noticed by the CEO: she asked you to figure out a way to support agents in objectively evaluating the fair monthly rent of a property based on its features. She noticed that the business greatly suffers when the rent set for a property is not aligned with the market. In fact, if the rent is too low, the agency fee (which is a fixed percentage of the agreed rent) will end up being lower than what it could have been, leaving profit on the table. On the other hand, if the ask is too high, revenues for the agency will take longer to materialize, causing a substantial impact on the cash flow. The traditional approach to set the monthly rent for new properties is a "negotiation" between owners and agents, who will use their market understanding (and sometimes the benchmark of similar properties) to convince the owners about the right rent to ask for.
You are sure that machine learning has the potential to make a difference, and you are resolute in finding an ML way to improve this business process. The idea that comes to mind is to use the database of the monthly rent of previously rented properties (for which we have available their full description) to predict the right monthly rent of future properties based on their objective characteristics. Such a data-driven approach, if well communicated, can ease the price-setting process and result in a mutual advantage for all the parties involved: the landlord and the agency will get a quick and profitable transaction, and the tenant will obtain a fair rent.
The prospect of building a machine able to predict rental prices is exhilarating and makes you impatient to start. You manage to obtain an extraction of the last 4,000 rental agreements signed at the agency (RomeHousing-History.xlsx). The table contains, for each property:
House_ID: a unique identifier of the property.
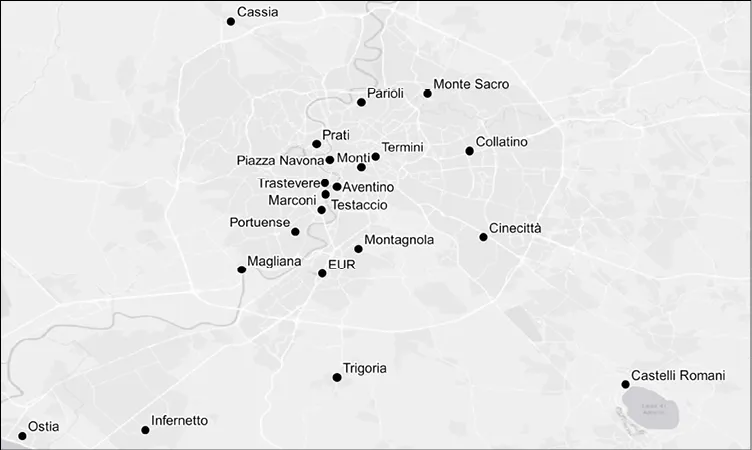
Neighborhood: the name of the area where the property lies, ranging from the fancy surroundings of PiazzaNavona to the tranquil, lakeside towns of CastelliRomani. Figure 5.1 shows a map of the Rome area with some of these neighborhoods.
Property_type: a string clarifying if the property is a flat, a house, a villa, or a penthouse.
Rooms: the number of available rooms in the property, including bathrooms.
Surface: the usable floor area of the property in square meters.
Elevator: a binary category indicating if an elevator is available (1) or not (0).
Floor_type: a category showing if the property is on a Mezzanine, a Ground floor, or an Upper level.
Floor_number: the floor number on which the property is situated, based on the European convention (0 is for the ground floor, 0.5 is the mezzanine, 1 is for the first level above the ground, and so on).
Rent: the all-inclusive, monthly rent in euros on the final rental agreement.
Figure 5.1: The Rome neighborhoods covered by our real estate. Have you visited any of these places already?
Before building the model, you wisely stop for a second and think through the ways you are going to practically leverage it once ready. You realize that the potential business value for completing this endeavor is two-fold:
First, by interpreting how the model works, you can find out some insightful evidence on the market price formation mechanisms. You might be able to find answers to the questions: what features really do make a difference in the pricing?, does the floor number impact the value greatly?, and which neighborhoods prove to be most expensive ones, at parity of all other characteristics of the property?. Some of the answers will reinforce the market understanding that your agency already has, adding the benefit of making this knowledge explicit and formally described. More interestingly, other findings might be truly unexpected and unveil original dynamics you did not know about.
Second, your model can be used to generate data-based recommendations on the rent to be set for new properties as they go on the market and enter the portfolio of the agency. To make things more interesting on this front, the owner shares with you a list (RomeHousing-NewProperties.xlsx) of 10 incoming properties for which the rental price has not been fixed yet, using the same features (such as Neighborhood, Property_type, and so on) available in the historical database. Once ready, you will apply your model to these sample properties as an illustration of how it works.
You are now clear on what the business requires, and you can finally translate it into definite machine learning terms, building on what we have learned in the previous chapter. You need to build a machine that predicts "unknown" rental prices by learning from some "known" examples: the database of previously rented properties is your labeled dataset, as it has examples of your target variable, in this case, the Rent. Going through the catalog of machine learning algorithms (Figure 4.5), you realize we are clearly in the category of supervised machine learning. More specifically, you need to predict numbers (rent in euros), so you definitely need to leverage an algorithm for doing a regression.
The ML way to solve this business opportunity is now clear in front of your eyes: you can finally get KNIME started and create a new workflow (File | New… | New KNIME Workflow):
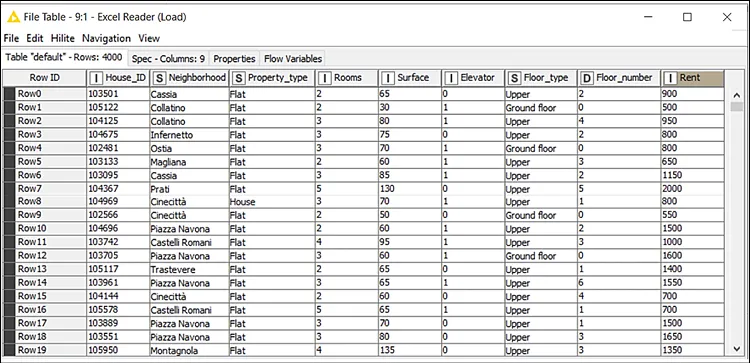
As a very first step, you load your labeled dataset by dragging and dropping the file(RomeHousing-History.xlsx) into your blank workflow or by implementing theExcel Readernode. In either case, KNIME will have recognized the structure of the file, and you just need to accept its default configuration. After running the node, you obtain the dataset shown in Figure 5.2, where you find the nine columns you expected:
Figure 5.2: Historical rental data loaded into KNIME: 4,000 properties to learn from
When you build a machine learning model, you will interact in various ways with the columns of your data table. It is sensible to get an understanding of what you are going to deal with by exploring the columns right at the beginning. Fortunately, the Statistics node helps as it displays at once the most important things you need to know about yo...
Table of contents
Preface
What is Data Analytics?
Getting Started with KNIME
Transforming Data
What is Machine Learning?
Applying Machine Learning at Work
Getting Started with Power BI
Visualizing Data Effectively
Telling Stories with Data
Extending Your Toolbox
And now?
Useful Resources
Other Books You May Enjoy
Index
Frequently asked questions
Yes, you can cancel anytime from the Subscription tab in your account settings on the Perlego website. Your subscription will stay active until the end of your current billing period. Learn how to cancel your subscription
No, books cannot be downloaded as external files, such as PDFs, for use outside of Perlego. However, you can download books within the Perlego app for offline reading on mobile or tablet. Learn how to download books offline
Perlego offers two plans: Essential and Complete
Essential is ideal for learners and professionals who enjoy exploring a wide range of subjects. Access the Essential Library with 800,000+ trusted titles and best-sellers across business, personal growth, and the humanities. Includes unlimited reading time and Standard Read Aloud voice.
Complete: Perfect for advanced learners and researchers needing full, unrestricted access. Unlock 1.5M+ books across hundreds of subjects, including academic and specialized titles. The Complete Plan also includes advanced features like Premium Read Aloud and Research Assistant.
Both plans are available with monthly, semester, or annual billing cycles.
We are an online textbook subscription service, where you can get access to an entire online library for less than the price of a single book per month. With over 1.5 million books across 990+ topics, we’ve got you covered! Learn about our mission
Look out for the read-aloud symbol on your next book to see if you can listen to it. The read-aloud tool reads text aloud for you, highlighting the text as it is being read. You can pause it, speed it up and slow it down. Learn more about Read Aloud
Yes! You can use the Perlego app on both iOS and Android devices to read anytime, anywhere — even offline. Perfect for commutes or when you’re on the go. Please note we cannot support devices running on iOS 13 and Android 7 or earlier. Learn more about using the app
Yes, you can access Data Analytics Made Easy by Andrea De Mauro in PDF and/or ePUB format, as well as other popular books in Business & Information Management. We have over 1.5 million books available in our catalogue for you to explore.