Acquire a better understanding of disease evolution and treatment response with Neuroradiology Spectrum and Evolution of Disease. The unique format includes carefully chosen clinical images that depict the pathologic evolution of disease from initial presentation across the continuum of progression. Colorful graphics plot characteristic changes, helping you visualize how normal and abnormal variations alter over time. Extensive illustrations and concise descriptions distill complex concepts, making this first-of-its-kind resource an excellent tool for imaging interpretation and clinical problem solving.- Presents neurologic disease from a novel imaging perspective, emphasizing evolutionary development and pointing out patterns to recognize.- Provides a state-of-the-art understanding of image interpretation based on early, middle, and late imaging characteristics; typical and atypical variants; and pre-treatment, post-treatment, progression, and regression characteristics.- Guides you through the progression of disease with chronological indicators, additional clinical images and descriptions, and annotations that highlight atypical findings – for an easy-to-digest, visually memorable presentation.- Helps you correctly interpret specific imaging characteristics you have never seen, even when the disease process is one you are familiar with.
eBook - ePub
Neuroradiology
Spectrum and Evolution of Disease
- 600 pages
- English
- ePUB (mobile friendly)
- Available on iOS & Android
eBook - ePub
Neuroradiology
Spectrum and Evolution of Disease
About this book
Trusted by 375,005 students
Access to over 1.5 million titles for a fair monthly price.
Study more efficiently using our study tools.
Information
Topic
MedicinaSubtopic
NeurologiaSection I
Brain
Parenchymal Hemorrhage and Trauma
1
Brain Parenchymal Hematoma Evolution
Juan E. Small
Key Words
Brain; Parenchymal; Hemorrhage; Hematoma
Introduction
Magnetic resonance imaging (MRI) can differentiate between acute, subacute, and chronic hemorrhage because of its sensitivity and specificity to hemoglobin degradation products. Therefore the imaging interpreter is, with proper knowledge, able to estimate the age of a brain parenchymal hematoma. The blood products in a hematoma evolve through a predictable variation in hemoglobin oxygenation states and hemoglobin byproducts. This predictable pattern of hematoma evolution over time leads to a specific pattern of changing signal intensities on conventional MRI.
There are limitations to the accuracy of hematoma age interpretation. Several direct and indirect factors, including the operating field strength of the magnet, the mode of image acquisition, and a wide range of biologic factors particular to the patient, may affect the imaging evolution of a parenchymal hematoma. Despite substantial variability, it is generally accepted that five stages of parenchymal hemorrhage can be distinguished by MRI. A basic understanding of the biochemical evolution of brain parenchymal hemorrhage and magnetic properties that affect MRI signal are essential for interpretation.
Temporal Evolution: Overview
A well-described pathophysiologic process of evolution and resorption for parenchymal hemorrhage involves five distinct phases (Fig. 1.1).
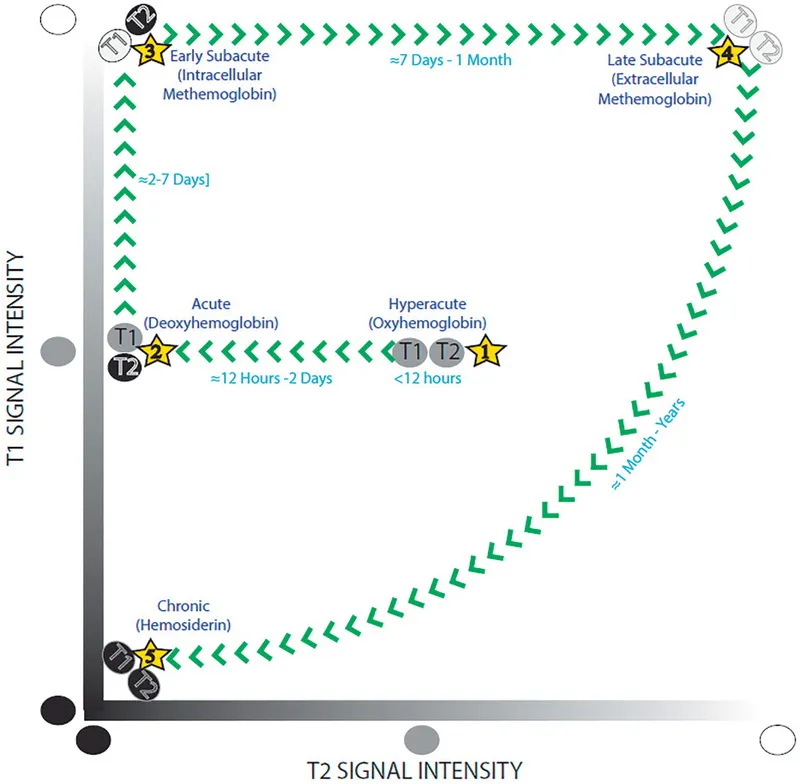
Figure 1.1 Five stages of parenchymal hematoma evolution on magnetic resonance imaging. One can easily remember the T1 and T2 characteristics of an evolving hematoma by memorizing this figure. Start from the center of the figure and move according to the direction of the arrows to remember the signal characteristics of the five distinct phases of hematoma evolution.
With this knowledge, the imaging interpreter can often identify the relative age of a brain parenchymal hematoma based on the T1 and T2 characteristics of the collection. However, it is important to realize that hematoma evolution is a fluid process (without static or punctuated steps). Therefore, stages of hemorrhage commonly coexist within the same hematoma because hemoglobin degradation proceeds at variable rates in the center versus the periphery of a single hematoma cavity. By convention, the most mature form of hemoglobin present defines the stage of hematoma evolution (Fig. 1.2).
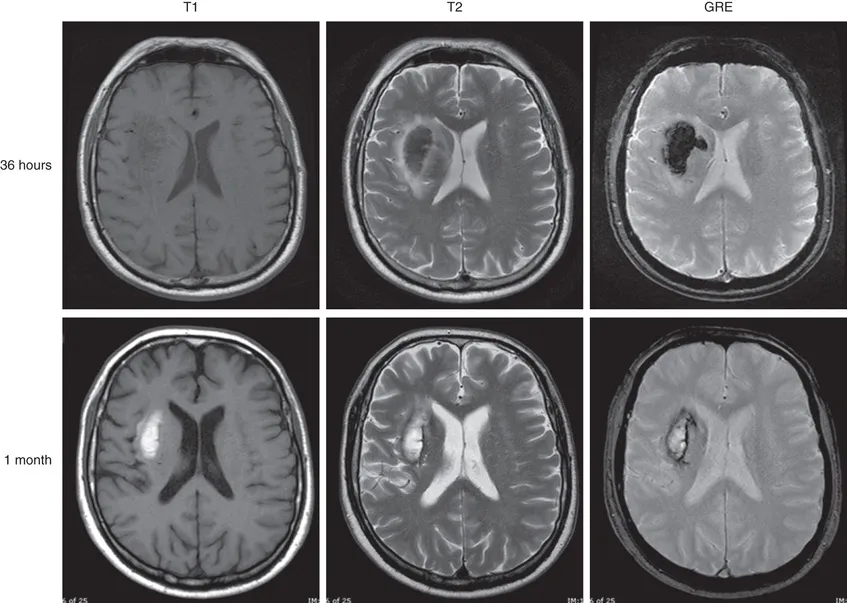
Figure 1.2 Parenchymal hemorrhage at 36 hours and at 1 month after initial presentation. At 36 hours (acute phase), T2 signal is low and T1 signal remains intermediate consistent with intracellular deoxyhemoglobin. There is diffuse hypointensity on the gradient echo (GRE) image due to the paramagnetic effects of deoxyhemoglobin. At 1 month (end of late subacute phase), central T1 and T2 hyperintensity is consistent with extracellular methemoglobin, while peripheral T1 and T2 low signal is consistent with hemosiderin. The rim is hypointense on the GRE image due to the superparamagnetic effects of hemosiderin. The hematoma is smaller due to retraction.
Temporal Evolution: in Greater Depth
Extravascular blood in a hemorrhagic collection remains as oxyhemoglobin for 2 to 3 hours. The immediate activation of the clotting cascade begins the process of clot formation. Deoxyhemoglobin begins to form at the periphery of the hematoma. Eventually, the failure of metabolic pathways preventing oxidation of heme iron results in conversion of hemoglobin to methemoglobin.
In the hyperacute stage, parenchymal hemorrhage is a liquid almost completely composed of intracellular oxygenated hemoglobin. Over the course of a few hours, a heterogeneous blood clot forms within the hematoma cavity, composed of red blood cells, platelets, and serum. In the acute phase, intracellular hemoglobin becomes deoxygenated. Vasogenic edema develops in the surrounding brain parenchyma. In the early subacute phase, deoxyhemoglobin is gradually converted to intracellular methemoglobin. Then, in the late subacute phase, lysis of red blood cells leads to the release of methemoglobin into the extracellular space. During this time, the surrounding vasogenic edema slowly begins to decrease and the clot slowly retracts. In the chronic stage, macrophages and glial cells phagocytose the hematoma, leading to intracellular ferritin and hemosiderin. Eventually, the hematoma resolves and leaves a posthemorrhagic cavity with hemosiderin-stained walls.
It is critical to realize that Fig. 1.1 represents a simplified version of events designed to aid in memory. As noted previously, hematoma evolution is a fluid process (without static or punctuated steps). Stages of hemorrhage commonly coexist within the same hematoma because hemoglobin degradation proceeds at variable rates in the center versus the periphery of a single hematoma cavity (Figs. 1.3 and 1.4).
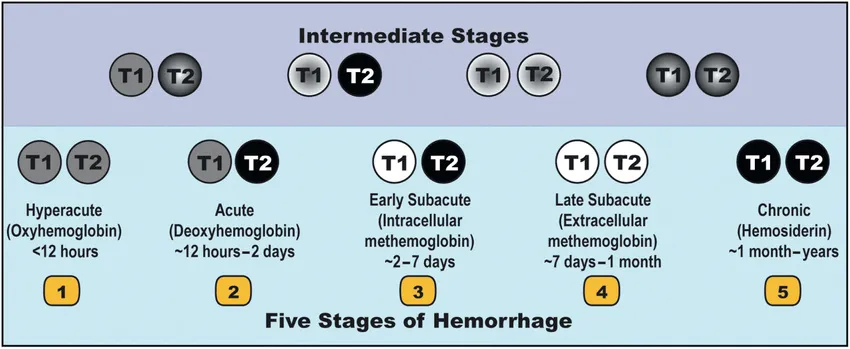
Figure 1.3 By convention, the most mature form of hemoglobin present defines the stage of hematoma evolution. The five stages of hemorrhage depicted in Fig. 1.1 are seen in the bottom row of Fig. 1.3. Each stage depicts the most mature form of hemoglobin present in the hematoma. They are not meant to imply homogeneity. The top row depicts intermediate stages of hematoma evolution between each step. In the intermediate stages, the most mature form of hemorrhage is seen at the periphery.
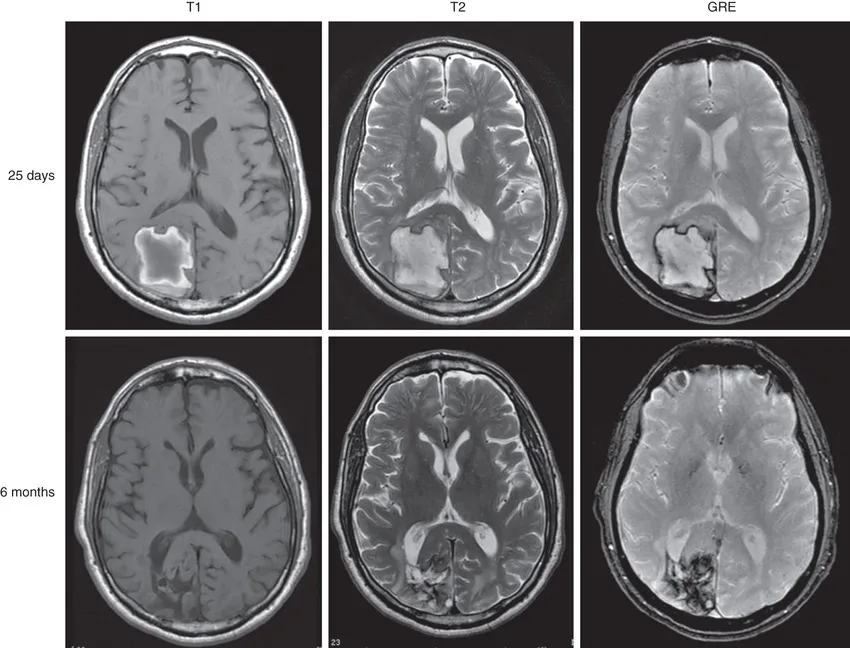
Figure 1.4 Parenchymal hemorrhage 25 days and 6 months after initial presentation. At 25 days (between early subacute to late subacute phase), there is ...
Table of contents
- Cover image
- Title Page
- Table of Contents
- Copyright
- Dedication
- Contributors
- Preface
- Acknowledgments
- Section I Brain
- Section II Spine
- Section III Head and Neck
- Index
Frequently asked questions
Yes, you can cancel anytime from the Subscription tab in your account settings on the Perlego website. Your subscription will stay active until the end of your current billing period. Learn how to cancel your subscription
No, books cannot be downloaded as external files, such as PDFs, for use outside of Perlego. However, you can download books within the Perlego app for offline reading on mobile or tablet. Learn how to download books offline
Perlego offers two plans: Essential and Complete
- Essential is ideal for learners and professionals who enjoy exploring a wide range of subjects. Access the Essential Library with 800,000+ trusted titles and best-sellers across business, personal growth, and the humanities. Includes unlimited reading time and Standard Read Aloud voice.
- Complete: Perfect for advanced learners and researchers needing full, unrestricted access. Unlock 1.5M+ books across hundreds of subjects, including academic and specialized titles. The Complete Plan also includes advanced features like Premium Read Aloud and Research Assistant.
We are an online textbook subscription service, where you can get access to an entire online library for less than the price of a single book per month. With over 1.5 million books across 990+ topics, we’ve got you covered! Learn about our mission
Look out for the read-aloud symbol on your next book to see if you can listen to it. The read-aloud tool reads text aloud for you, highlighting the text as it is being read. You can pause it, speed it up and slow it down. Learn more about Read Aloud
Yes! You can use the Perlego app on both iOS and Android devices to read anytime, anywhere — even offline. Perfect for commutes or when you’re on the go.
Please note we cannot support devices running on iOS 13 and Android 7 or earlier. Learn more about using the app
Please note we cannot support devices running on iOS 13 and Android 7 or earlier. Learn more about using the app
Yes, you can access Neuroradiology by Juan E. Small,Daniel L. Noujaim,Daniel T. Ginat,Hillary R. Kelly,Pamela W. Schaefer,Juan Small,Daniel Noujaim,Daniel T. Thomas Ginat,Hillary R Kelly,Pamela W Schaefer in PDF and/or ePUB format, as well as other popular books in Medicina & Neurologia. We have over 1.5 million books available in our catalogue for you to explore.