MrExcel 2021: Unmasking Excel delivers practical, real-world solutions for mastering Excel's most powerful features, including pivot tables, formulas, data models, and Power Query. Discover the latest enhancements, such as LET and LAMBDA functions, dynamic array formulas, and new data types, to transform your spreadsheets and gain a competitive edge. Whether you're a seasoned professional or an aspiring data analyst, this guide will empower you to become an Excel guru and unlock new levels of productivity.

- 256 pages
- English
- ePUB (mobile friendly)
- Available on iOS & Android
eBook - ePub
About this book
Unlock the full potential of Microsoft Excel with expert tips and techniques. This comprehensive guide, updated for 2021, is designed for Excel users who want to take their skills to the next level. Learn how to streamline your workflow, automate tasks, and solve complex data problems with ease.
Trusted by 375,005 students
Access to over 1 million titles for a fair monthly price.
Study more efficiently using our study tools.
Information
#1 Ask Excel's A.I. a Question About Your Data
A new Natural Language Query feature started rolling out to Microsoft 365 in late 2019. The feature uses artificial intelligence to answer questions about your data.
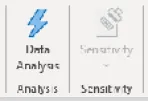
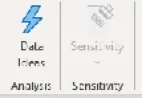
The feature can be found near the right side of the Home tab. The icon is a blue lightning bolt. The label for the icon has changed between Insights, Ideas, Data Analysis, and Data Ideas.
Note: Microsoft loves to do A|B testing with feature names. As I write this book, they are conducting one such test. One of my computers is calling the feature Data Analysis and the other is calling it Data Ideas. Microsoft might call it Analyze Data or Clippy 2.0. Any name will operate the same. By the time you are reading this, they will have settled on a name. In any case, look for the blue lightning bolt that is second from the right side of the Home tab.
It is the #1 tip in this book because of this problem: (1) The feature has the potential to help millions of people, and (2) it is hidden where no one will find it.
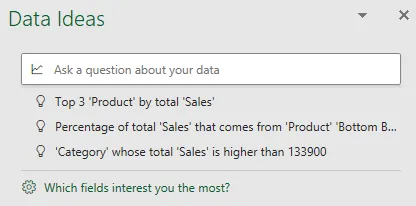
Anyone can perform advanced data analysis by simply asking questions by typing a sentence. Your data set can be up to 250,000 cells. Select one cell in your data. Use the blue lightning bolt icon on the right side of the Home tab.

A box says to Ask A Question About Your Data and it gives you a few sample questions.
Type a question such as "Top 3 Products by 'Sales' where Category is "Bikes"". Excel restates your question and shows you a thumbnail of the report.
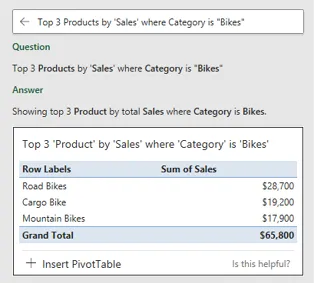
If this is the correct analysis, you can use the +Insert Pivot Table icon to insert the results into a new worksheet in your workbook.
Sometimes the feature will give you a chart when you want a table. Try adding "as table" to the end of your sentence.
The "Is this helpful?" link in the lower right is not being used. The original idea was to use Machine Learning to suggest better reports in the future. But the reality is that Microsoft is taking privacy very seriously and they can't learn without retaining your data.
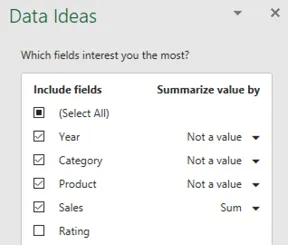
New for 2021 is the "Which Fields Interest You the Most?". This can be used to tell Excel that they should never offer to sum fields such as Year, Part Number, or Cost Center. You can choose to Sum or Average numeric fields. Or you can uncheck the field to make sure it is not in any of the suggestions.
Even before you type a question, Excel will offer you 5-10 suggested reports and a link to load up to 30 more reports. If you aren't sure what you are looking for, it is sometimes interesting to read through these suggested reports.
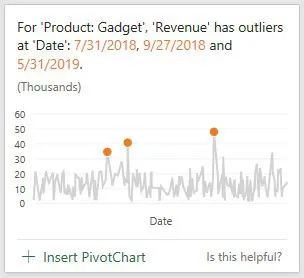
My one complaint about the feature is shown in the following chart. Ideas was able to find some outliers in this data and offers to create a chart with those points called out in orange. For this chart to work correctly, Excel would have to support conditional formatting in charts and it does not. That means that the pivot chart will always call out these three points, even if the underlying data changes and new outliers emerge. You would have to re-run Ideas and hope that a similar result is offered.
#2 Double-Click the Fill Handle to Copy a Formula
You have thousands of rows of data. You’ve added a new formula in the top row of your data set, something like =PROPER(A2&" "&B2), as shown here. You need to copy the formula down to all of the rows of your data set.
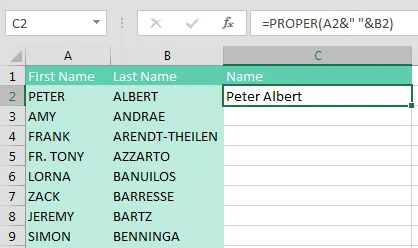
Many people will grab the Fill Handle and start to drag down. But as you drag down, Excel starts going faster and faster. There is a 200-microsecond pause at the last row of data. 200 microseconds is long enough for you to notice the pause but not long enough for you to react and let go of the mouse button. Before you know it, you’ve dragged the...
Table of contents
- About the Author
- About the Illustrators
- Foreword
- Sample File Downloads
- #1 Ask Excel's A.I. a Question About Your Data
- #2 Double-Click the Fill Handle to Copy a Formula
- #3 Break Apart Data
- #4 Convert Text Numbers to Numbers Quickly
- #5 Filter by Selection
- #6 Total the Visible Rows
- #7 Save Filter & Sorting in Sheet View
- #8 The Fill Handle Does Know 1, 2, 3…
- #9 Fast Worksheet Copy
- #10 Use Default Settings for All Future Workbooks
- #11 Recover Unsaved Workbooks
- #12 Simultaneously Edit a Workbook in Microsoft 365
- #13 New Threaded Comments Allow Conversations
- #14 Create Perfect One-Click Charts
- #15 Paste New Data on a Chart
- #16 Create Interactive Charts
- #17 Show Two Different Orders of Magnitude on a Chart
- #18 Create Waterfall Charts
- #19 Create Funnel Charts
- #20 Create Filled Map Charts in Microsoft 365
- #21 Create a Bell Curve
- #22 Plotting Employees on a Bell Curve
- #23 Add Meaning to Reports Using Data Visualizations
- #24 Use People to Add Interest to Your Worksheet
- #25 Make an Image Semi-Transparent
- #26 Save Any Object as an Image
- #27 Set Up Your Data for Data Analysis
- #28 Sort East, Central, and West Using a Custom List
- #29 Sort Left to Right
- #30 Sort Subtotals
- #31 Sort and Filter by Color or Icon
- #32 Consolidate Quarterly Worksheets
- #33 Create Your First Pivot Table
- #34 Create a Year-over-Year Report in a Pivot Table
- #35 Change the Calculation in a Pivot Table
- #36 Find the True Top Five in a Pivot Table
- #37 Specify Defaults for All Future Pivot Tables
- #38 Make Pivot Tables Expandable Using Ctrl+T
- #39 Replicate a Pivot Table for Each Rep
- #40 Use a Pivot Table to Compare Lists
- #41 Build Dashboards with Sparklines and Slicers
- #42 See Why GETPIVOTDATA Might Not Be Entirely Evil
- #43 Eliminate VLOOKUP or XLOOKUP with the Data Model
- #44 Compare Budget Versus Actual via Power Pivot
- #45 Slicers for Pivot Tables From Two Data Sets
- #46 Use F4 for Absolute Reference or Repeating Commands
- #47 Quickly Convert Formulas to Values
- #48 See All Formulas at Once
- #49 Audit a Worksheet With Spreadsheet Inquire
- #50 Discover New Functions by Using fx
- #51 Use Function Arguments for Nested Functions
- #52 Calculate Nonstandard Work Weeks
- #53 Turn Data Sideways with a Formula
- #54 Handle Multiple Conditions in IF
- #55 Troubleshoot VLOOKUP
- #56 Use a Wildcard in VLOOKUP
- #57 Replace Columns of VLOOKUP with a Single MATCH
- #58 Lookup to the Left with INDEX/MATCH
- #59 Twelve Benefits of XLOOKUP
- #60 Preview What Remove Duplicates Will Remove
- #61 Replace Nested IFs with a Lookup Table
- #62 Suppress Errors with IFERROR
- #63 Handle Plural Conditions with SUMIFS
- #64 Geography, Exchange Rate & Stock Data Types in Excel
- #65 Get Historical Stock History from STOCKHISTORY
- #66 More Data Types from Wolfram Alpha
- #67 Getting Historical Weather For a City
- #68 Create Your Own Data Types Using Power Query
- #69 IF Based on Installed Language in a Bilingual Worksheet
- #70 Dynamic Arrays Can Spill
- #71 Sorting with a Formula
- #72 Filter with a Formula
- #73 Formula for Unique or Distinct
- #74 Other Functions Can Now Accept Arrays as Arguments
- #75 One Hit Wonders with UNIQUE
- #76 SEQUENCE inside of other Functions such as IPMT
- #77 Replace a Pivot Table with 3 Dynamic Arrays
- #78 Dependent Validation using Dynamic Arrays
- #79 Complex Validation Using a Formula
- #80 Use A2:INDEX() as a Non-Volatile OFFSET
- #81 Subscribe to Microsoft 365 for Monthly Features
- #82 Performance Improvements in 2020 for Microsoft 365
- #83 Unhide Multiple Worksheets
- #84 Write Your Data with the Action Pen
- #85 Many Task Panes Now Collapse into a Tab Strip
- #86 How to Provide Usable Feedback to the Excel Team
- #87 Date Tricks in Excel
- #88 Use the LET Function to Re-Use Variables in a Formula
- #89 Store Complex Formula Logic in LAMBDA function
- #90 Find Largest Value That Meets One or More Criteria
- #91 Less CSV Nagging and Better AutoComplete
- #92 Speed Up VLOOKUP
- #93 Protect All Formula Cells
- #94 Back into an Answer by Using Goal Seek
- #95 Do 60 What-If Analyses with a Sensitivity Analysis
- #96 Find Optimal Solutions with Solver
- #97 Improve Your Macro Recording
- #98 Clean Data with Power Query
- #99 Use Fuzzy Match in Power Query
- #100 Render Excel Data on an iPad Dashboard Using Power BI
- #101 Build a Pivot Table on a Map Using 3D Maps
- #102 The Forecast Sheet Can Handle Some Seasonality
- #103 Perform Sentiment Analysis in Excel
- #104 Build Org Charts with the Visio Data Visualizer in Excel
- #105 Fill in a Flash
- #106 Format as a Façade
- #107 Show All Open Workbooks in the Windows Taskbar
- #108 Surveys & Forms in Excel
- #109 Use the Windows Magnifier
- #110 Word for Excellers
- #111 Avoid Whiplash with Speak Cells
- #112 Customize the Quick Access Toolbar
- #113 Create Your Own QAT Routines Using VBA Macros
- #114 Favorite Keyboard Shortcuts
- #115 Ctrl+Click to Unselect Cells
- #116 Collapse the Search Box
- #117 More Excel Tips
- #118 Excel Stories
- #119 Excel Function Quick Reference
- #120 Index
Frequently asked questions
Yes, you can cancel anytime from the Subscription tab in your account settings on the Perlego website. Your subscription will stay active until the end of your current billing period. Learn how to cancel your subscription
No, books cannot be downloaded as external files, such as PDFs, for use outside of Perlego. However, you can download books within the Perlego app for offline reading on mobile or tablet. Learn how to download books offline
Perlego offers two plans: Essential and Complete
- Essential is ideal for learners and professionals who enjoy exploring a wide range of subjects. Access the Essential Library with 800,000+ trusted titles and best-sellers across business, personal growth, and the humanities. Includes unlimited reading time and Standard Read Aloud voice.
- Complete: Perfect for advanced learners and researchers needing full, unrestricted access. Unlock 1.4M+ books across hundreds of subjects, including academic and specialized titles. The Complete Plan also includes advanced features like Premium Read Aloud and Research Assistant.
We are an online textbook subscription service, where you can get access to an entire online library for less than the price of a single book per month. With over 1 million books across 990+ topics, we’ve got you covered! Learn about our mission
Look out for the read-aloud symbol on your next book to see if you can listen to it. The read-aloud tool reads text aloud for you, highlighting the text as it is being read. You can pause it, speed it up and slow it down. Learn more about Read Aloud
Yes! You can use the Perlego app on both iOS and Android devices to read anytime, anywhere — even offline. Perfect for commutes or when you’re on the go.
Please note we cannot support devices running on iOS 13 and Android 7 or earlier. Learn more about using the app
Please note we cannot support devices running on iOS 13 and Android 7 or earlier. Learn more about using the app
Yes, you can access MrExcel 2021 by Bill Jelen in PDF and/or ePUB format, as well as other popular books in Computer Science & Desktop Applications. We have over one million books available in our catalogue for you to explore.