With the effects of climate change already upon us, the need to cut global greenhouse gas emissions is nothing less than urgent. It’s a daunting challenge, but the technologies and strategies to meet it exist today. A small set of energy policies, designed and implemented well, can put us on the path to a low carbon future. Energy systems are large and complex, so energy policy must be focused and cost-effective. One-size-fits-all approaches simply won’t get the job done. Policymakers need a clear, comprehensive resource that outlines the energy policies that will have the biggest impact on our climate future, and describes how to design these policies well.
Designing Climate Solutions: A Policy Guide for Low-Carbon Energy is the first such guide, bringing together the latest research and analysis around low carbon energy solutions. Written by Hal Harvey, CEO of the policy firm Energy Innovation, with Robbie Orvis and Jeffrey Rissman of Energy Innovation, Designing Climate Solutions is an accessible resource on lowering carbon emissions for policymakers, activists, philanthropists, and others in the climate and energy community. In Part I, the authors deliver a roadmap for understanding which countries, sectors, and sources produce the greatest amount of greenhouse gas emissions, and give readers the tools to select and design efficient policies for each of these sectors. In Part II, they break down each type of policy, from renewable portfolio standards to carbon pricing, offering key design principles and case studies where each policy has been implemented successfully.
We don’t need to wait for new technologies or strategies to create a low carbon future—and we can’t afford to. Designing Climate Solutions gives professionals the tools they need to select, design, and implement the policies that can put us on the path to a livable climate future.
eBook - ePub
Designing Climate Solutions
A Policy Guide for Low-Carbon Energy
- 360 pages
- English
- ePUB (mobile friendly)
- Available on iOS & Android
eBook - ePub
Designing Climate Solutions
A Policy Guide for Low-Carbon Energy
About this book
Trusted by 375,005 students
Access to over 1.5 million titles for a fair monthly price.
Study more efficiently using our study tools.
Information
PART I
A Roadmap for Reducing Greenhouse Gas Emissions
Significant reductions in greenhouse gas emissions are necessary to limit climate change and stay under two degrees of warming by the end of century. To identify where reductions will be most effective, it is necessary to examine the greatest sources of emissions. Seventy-five percent of global greenhouse gas emissions come from just 20 countries. Furthermore, 94 percent of emissions come from industrial processes and the energy used in power and heat generation, transportation, industry, and buildings. These findings show that we must focus our efforts on reducing emissions from industrial processes and energy in the top 20 countries.
Policymakers have many options available to tackle emissions. Policies can generally be classified as one of four types, each of which reinforces the others: performance standards, economic signals, support for research and development (R&D), and supporting policies.
Performance standards improve new equipment and help capture savings that economic signals cannot, because of market barriers. Economic signals can be highly efficient and encourage the uptake of more efficient equipment driven by performance standards. Support for R&D and enabling policies lower the costs of performance standards and economic signals by pushing new technologies to market and lowering the costs of existing technologies by removing deployment market barriers.
There is no silver bullet policy for tackling emissions. Rather, a portfolio of policies that reinforce one another is the best approach. In Part I, we’ll discuss the suite of policies available, strategies for identifying the most effective options, and principles for designing successful policy programs. Quantitative modeling reveals that these policies, designed and implemented well, can put the world on track to a future where warming is limited to two degrees or less.
CHAPTER ONE
Putting Us on Track to a Low-Carbon Future
As outlined in the Introduction, significant reductions in greenhouse gas emissions are needed to avoid the worst impacts of climate change. But how much effort is needed? What types of reductions and emissions pathways are needed in order to avoid the worst parts of climate change? And how we do know where to focus our efforts? This chapter tackles these questions and highlights the sectors where our efforts will have the greatest impact.
Avoiding the Worst Impacts of Climate Change
The level of greenhouse gases in the atmosphere is measured in parts per million, or the number of greenhouse gas particles per million particles in the atmosphere. The impact of gases other than carbon dioxide is measured by equating those gases to an equivalent amount of carbon dioxide, called carbon dioxide equivalent (CO2e). The equivalence of gases ranges widely. For example, 1 molecule of methane equals about 30 molecules of carbon dioxide, whereas other chemicals such as fluorinated gases, used primarily as refrigerants, are thousands of times more potent than carbon dioxide per molecule. Notably, the equivalence value varies based on the timeframe over which the gas is evaluated (methane has a higher equivalence over 20 years than over 100 years, for example) and as the science of climate change advances. The total amount of CO2e in the atmosphere includes CO2 as well as all the other gases that contribute to climate change.
There is broad consensus that preventing the worst impacts of climate change requires keeping global warming below two degrees Celsius through the end of the 21st century. To have at least a 50/50 chance of limiting warming to two degrees, we must limit concentrations of CO2e to 500 parts per million by 2100, although some overshoot of this target in previous years is okay.1 Yet in 2015, CO2e concentrations measured 485 parts per million, and they have been increasing at a rate of 2–4 parts per million per year.2 To achieve the 500 parts per million target by 2100, immediate on-the-ground action is needed. But what does this mean in terms of emissions?
Climate change and the warming that drives it are a function of the total amount of carbon in the atmosphere. In other words, it is a stock problem, not a flow problem, as discussed in the Introduction. Therefore, it is useful to think of emissions, and necessary emission reductions, in terms of cumulative totals rather than annual amounts. Significant action to reduce emissions will be needed throughout the 21st century, but for simplicity and given the growing uncertainty in years further out, we focus on the necessary reductions between now and 2050.
Without additional action to reduce greenhouse gas emissions, just over 2 trillion tons of CO2e will be emitted between 2016 and 2050.3 Although climate models vary, they show that in order to meet the 500 parts per million target, cumulative total emission reductions of 25 to 55 percent relative to a business-as-usual scenario are necessary between 2016 and 2050.4
For this book, we rely on modeling completed in 2013 as part of the Low Climate Impact Scenarios and the Implications of Required Tight Emissions Control Strategies (LIMITS) exercise. In particular we rely on the modeling done by Pacific Northwest National Laboratory and the Joint Global Change Research Institute using the Global Change Assessment Model, evaluating emissions between 2010 and 2050. More information on the Global Change Assessment Model, the LIMITS study, and emission scenarios from the Intergovernmental Panel on Climate Change is provided in Appendix II.
The results of the LIMITS study suggest that to have a 50/50 shot at staying under two degrees of warming we need to reduce cumulative greenhouse gas emissions by at least 41 percent between 2010 and 2050 (Figure 1-1).
This value is global; emission reductions needed from individual countries will vary, depending on their development status. For example, the most industrialized countries will need to achieve significantly deeper reductions than the 41 percent global number to compensate for other emerging economies with high rates of economic development. It’s also worth noting that a 41 percent reduction in cumulative emissions entails much greater annual emission reductions in later years as emission reductions are phased in. In 2050, global annual emission reductions of 65 percent relative to business-as-usual will be necessary, with the more economically developed regions needing to achieve reductions of 70 percent or more.
This book evaluates potential reductions at a global scale. According to the Global Change Assessment Model results discussed earlier, we need cumulative greenhouse gas emission reductions of just over 40 percent between 2020 and 2050 relative to business as usual to give ourselves a 50/50 shot at staying under two degrees of warming. This is the target we aim for in this book.
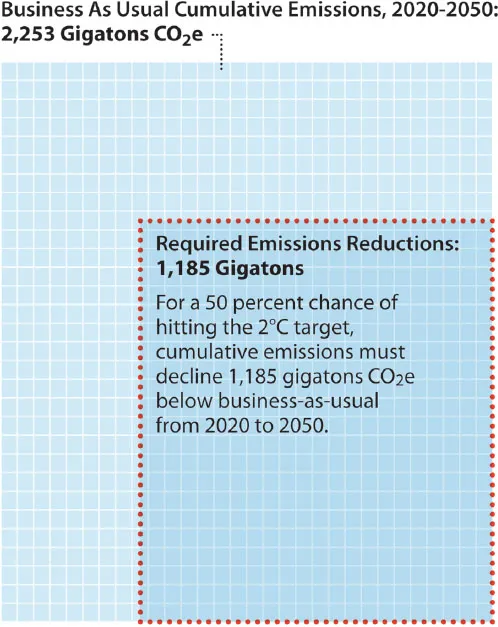
Figure 1-1. Emission reductions needed for a 50 percent chance of avoiding 2°C global warming. (Analysis done using data with permission from the International Institute for Applied Systems Analysis [IIASA]. Data source: Tavoni et al., 2013. Data downloaded from the LIMITS Scenario database hosted at IIASA, https://tntcat.iiasa.ac.at/LIMITSPUBLICDB/dsd?Action=htmlpage&page=about.)
The Paris Agreement: A Good First Step
In December 2015, 189 countries responsible for nearly 99 percent of the world’s greenhouse gas emissions signed the Paris Agreement,5 in which they agreed to make an effort to limit emissions over the next 10 to 30 years. The centerpiece of the Paris Agreement is each country’s specific emission reductions targets.
If the targets are all met, they would collectively move emissions a good share of the way to the two-degree pathway. As shown in Figure 1-2, the Paris Agreement commitments, on their own, move the emission curve about a third of the way to the two-degree pathway relative to business-as-usual. If existing policies and the Paris pledges are extended to 2100 with the same degree of effort, the emission curve moves about 80 percent of the way to the two-degree pathway. Despite the United States’ decision to withdraw from the Paris Agreement, commitments from remaining countries still cover more than 80 percent of the world’s emissions today. Furthermore, U.S. states, cities, and businesses have expressed their commitment to meeting emission reduction targets, which will help reduce U.S. emissions.
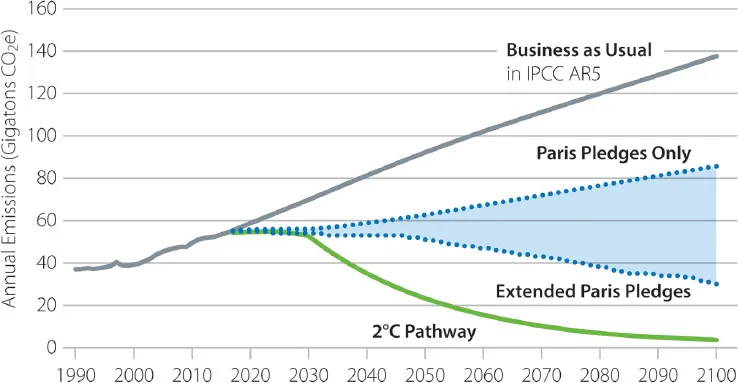
Figure 1-2. Pledges made as part of the Paris Agreement get us partway to the 2°C pathway. (Graph data reproduced with permission from Climate Interactive and Climate Action Tracker, “Climate Action Tracker: Global Emissions Time Series,” Climate Action Tracker, 2015, http://climateactiontracker.org/assets/Global/december_2015/CAT_public_data_emissions_ pathways_Dec15.xls; “Scoreboard Science and Data,” Climate Interactive, December 20, 2013, https://www.climateinteractive.org/programs/scoreboard/scoreboard-science-and-data/.)
The commitments enshrined in the Paris Agreement represent a significant diplomatic accomplishment and provide a very important impetus to move the global economy in the right direction. However, the existing commitments do not themselves add up to the two-degree pathway. And, perhaps more importantly, the pledges on their own will not result in on-the-ground emission reductions. Domestic policy is needed to drive change in the power plants, factories, buildings, vehicles, and forests. These shortcomings raise two important questions: First, how can policymakers close the gap between the existing Paris commitments and the two-degree pathway? Second, how can policymakers translate the targets into real-world emission reductions?
Focus on the Highest-Emitting Countries
Although the Paris Agreement encompasses nearly 99 percent of global emissions (not including the proposed U.S. withdrawal, which drops it down to about 82 percent), just 20 countries account for nearly 75 percent of global greenhouse gas emissions (Figures 1-3 and 1-4). The top 20 emitting countries all submitted pledges in 2015 (although, as noted, the United States has announced its withdrawal since then), but many of these countries have the potential to significantly strengthen their commitments. For example, Climate Action Tracker, an independent group that tracks and evaluates climate policy, rates the following countries’ pledges as “Inadequate”: Russia (4th largest emitter), Indonesia (5th largest emitter), Japan (7th largest emitter), Canada (8th largest emitter), Australia (12th largest emitter), South Korea (13th largest emitter), and South Africa (17th largest emitter).6 Even the two largest emitters, China and the United States, have only “Medium” ratings for their pledges.7 The weak contributions from many of the top-emitting countries, including 4 of the top 10, suggest that targeting these countries for additional reductions could make a positive impact on global emissions and help move global commitments closer to the two-degree pathway.
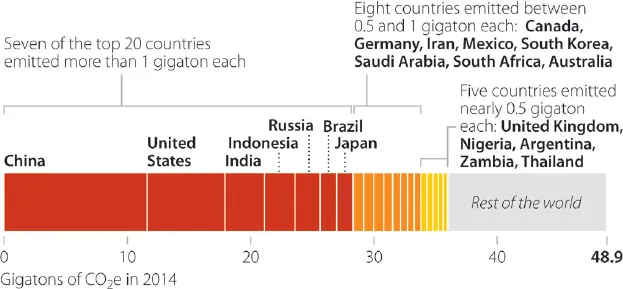
Figure 1-3. The top 20 emitting countries are responsible for roughly 75 percent of global emissions. (Graph data reproduced with permission from CAIT Climate Data Explorer, 2017 [Washington, DC: World Resources Institute], available online at cait.wri.org.)
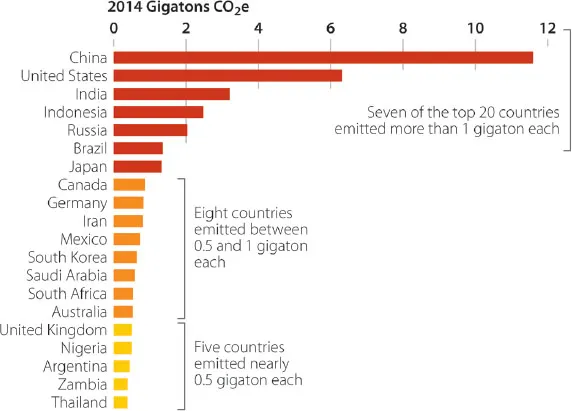
Figure 1-4. Emissions vary widely in the top 20 emitting countries, dominated by China and the United States. (Graph data reproduced with permission from CAIT Climate Data Explorer, 2017 [Washington, DC: World Resources Institute], cait.wri.org.)
Energy and Industrial Processes Drive Greenhouse Gas Emissions
The second and perhaps more important question is: How do countries translate pledges, which are simply high-level emission targets, into actionable policy that will achieve real-world emission reductions? Answering this question requires an assessment of what sources are responsible for greenhouse gas pollution.
Energy and industrial process (including agriculture and waste) emissions are by far the largest driver of CO2e emissions globally (Figure 1-5).8 Energy-related emissions account for just under 74 percent of global emissions, and industrial processes account for nearly 20 percent. Together, they total nearly 94 percent of global greenhouse gas emissions. In some countries, such as Indonesia, Brazil, and Nigeria, deforestation and other land use change emissions are significant sources of greenhouse gases.9
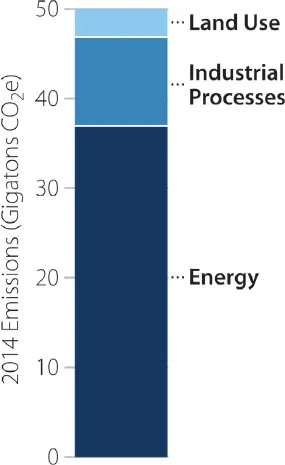
Figure 1-5. CO2e emissions are primarily from energy and industrial processes. (Graph data reproduced with permission from CAITClimate Data Explorer, 2017, [Washington, DC: World Resources Institute], cait.wri.org.)
The sources of industrial process emissions are well documented, and specific policies targeting those emissions are discussed in Chapter 12 (“Industrial Process Emission Policies”). Given the fact that energy is the largest source of greenhouse gas emissions, the next logical question becomes: What drives energy-related greenhouse gas emissions?
Energy-related greenhouse gas emissions are concentrated in the el...
Table of contents
- Cover
- Title Page
- Copyright
- Contents
- Foreword
- Acknowledgments
- Introduction
- Part I: A Roadmap for Reducing Greenhouse Gas Emissions
- Part II: The Top Policies for Greenhouse Gas Abatement
- Appendix I. The Energy Policy Simulator
- Appendix II. Methodology for Quantitative Policy Assessment
- Notes
- Index
- About the Authors
Frequently asked questions
Yes, you can cancel anytime from the Subscription tab in your account settings on the Perlego website. Your subscription will stay active until the end of your current billing period. Learn how to cancel your subscription
No, books cannot be downloaded as external files, such as PDFs, for use outside of Perlego. However, you can download books within the Perlego app for offline reading on mobile or tablet. Learn how to download books offline
Perlego offers two plans: Essential and Complete
- Essential is ideal for learners and professionals who enjoy exploring a wide range of subjects. Access the Essential Library with 800,000+ trusted titles and best-sellers across business, personal growth, and the humanities. Includes unlimited reading time and Standard Read Aloud voice.
- Complete: Perfect for advanced learners and researchers needing full, unrestricted access. Unlock 1.5M+ books across hundreds of subjects, including academic and specialized titles. The Complete Plan also includes advanced features like Premium Read Aloud and Research Assistant.
We are an online textbook subscription service, where you can get access to an entire online library for less than the price of a single book per month. With over 1.5 million books across 990+ topics, we’ve got you covered! Learn about our mission
Look out for the read-aloud symbol on your next book to see if you can listen to it. The read-aloud tool reads text aloud for you, highlighting the text as it is being read. You can pause it, speed it up and slow it down. Learn more about Read Aloud
Yes! You can use the Perlego app on both iOS and Android devices to read anytime, anywhere — even offline. Perfect for commutes or when you’re on the go.
Please note we cannot support devices running on iOS 13 and Android 7 or earlier. Learn more about using the app
Please note we cannot support devices running on iOS 13 and Android 7 or earlier. Learn more about using the app
Yes, you can access Designing Climate Solutions by Hal Harvey,Robbie Orvis,Jeffrey Rissman in PDF and/or ePUB format, as well as other popular books in Technology & Engineering & Energy Industry. We have over 1.5 million books available in our catalogue for you to explore.