How do cities transform over time? And why do some cities change for the better while others deteriorate? In articulating new ways of viewing urban areas and how they develop over time, Peter Bosselmann offers a stimulating guidebook for students and professionals engaged in urban design, planning, and architecture. By looking through Bosselmann’s eyes (aided by his analysis of numerous color photos and illustrations) readers will learn to “see” cities anew.
Bosselmann organizes the book around seven “activities”: comparing, observing, transforming, measuring, defining, modeling, and interpreting. He introduces readers to his way of seeing by comparing satellite-produced “maps” of the world’s twenty largest cities. With Bosselmann’s guidance, we begin to understand the key elements of urban design. Using Copenhagen, Denmark, as an example, he teaches us to observe without prejudice or bias.
He demonstrates how cities transform by introducing the idea of “urban morphology” through an examination of more than a century of transformations in downtown Oakland, California. We learn how to measure quality-of-life parameters that are often considered immeasurable, including “vitality,” “livability,” and “belonging.” Utilizing the street grids of San Francisco as examples, Bosselmann explains how to define urban spaces. Modeling, he reveals, is not so much about creating models as it is about bringing others into public, democratic discussions. Finally, we find out how to interpret essential aspects of “life and place” by evaluating aerial images of the San Francisco Bay Area taken in 1962 and those taken forty-three years later.
Bosselmann has a unique understanding of cities and how they “work.” His hope is that, with the fresh vision he offers, readers will be empowered to offer inventive new solutions to familiar urban problems.
- 336 pages
- English
- ePUB (mobile friendly)
- Available on iOS & Android
eBook - ePub
About this book
Trusted by 375,005 students
Access to over 1.5 million titles for a fair monthly price.
Study more efficiently using our study tools.
Information
Topic
ArchitectureSubtopic
Architecture GeneralCHAPTER ONE
To Compare
Cities, Size, Scale, and Form
Coastlines, lakeshores, rivers, and mountain ridges are chiefly responsible for the shape of cities. Views from space suggest that even the largest of the world’s great cities were shaped by their natural location. The ground plain for the city of Los Angeles originated through crustal upheaval, and the rivers that emerged on its slopes have almost disappeared, but on a satellite image the shape of the large drainage basin that the city occupies is impressive and understandably its most important form-giving element.
Only recently have new parts of Cairo started to climb away from the Nile River valley onto the rim of the Sahara desert, where they have begun to encroach on the pyramids. Likewise, Shanghai has only recently crossed the Huangpu River, even if future satellite images will almost certainly show it stretched out onto the large fertile plain of the Yangtze River Delta.
As urban population grows, it will be highly relevant to watch the cities of this world from space—and not only the expanding cities of the developing world but also the dispersing cities1 in the developed world. If one were to imagine for a moment that it would be possible to direct the growth of cities in the developing world—that is, not to stop the influx of rural migration but to direct the renewal and expansion at their outskirts—future satellite images would show a web of linear gaps in settlement patterns, where now continuous urbanization occurs. These gaps would coincide with the existing water drainage patterns. For reasons that we well understand, new urbanization would stay at a distance from water: from creeks, rivers, bays, and estuaries. Of all physical measures, the preservation of land near water would provide the greatest benefits for human health, health of vegetation and animal life, quality of the air, and a more comfortable climate.
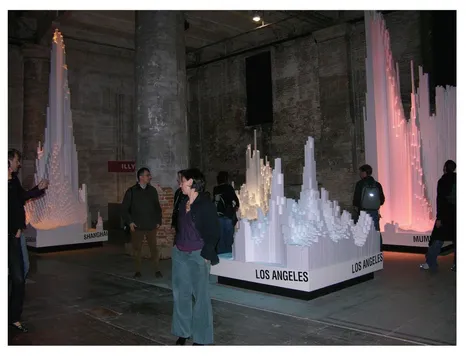
Figure 1.1 Venice Biennale on the Future of Cities held at the Venice Arsenal in 2006. Three-dimensional models show population density in relation to surface area for the world’s largest cities.
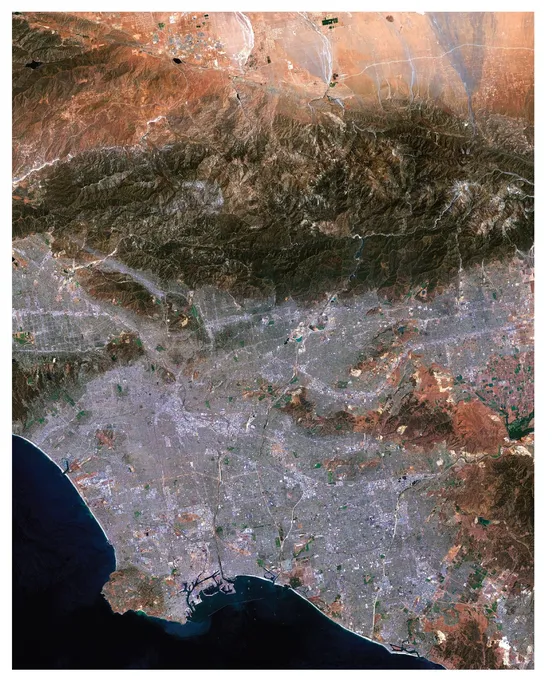
Figure 1.2 Los Angeles from space. The ground plain for the city of Los Angeles originated through an upheaval of the earth’s crust, and the rivers that emerged on its slopes have almost disappeared, but on a satellite image the shape of the large drainage basin that the city occupies is impressive and is understandably the city’s most important form-giving element. (Courtesy NPA Satellite Mapping)
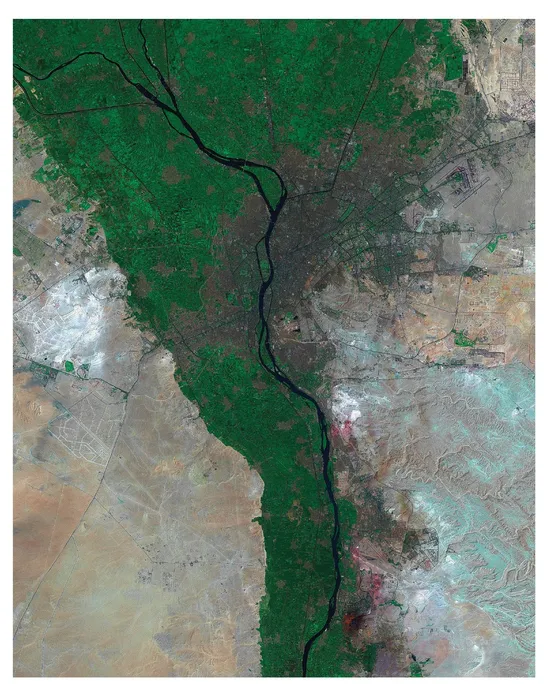
Figure 1.3 Cairo from space. Only recently have new parts of Cairo started to climb away from the Nile River plain onto the rim of the Sahara desert, where they have begun to encroach on the pyramids. (Courtesy NPA Satellite Mapping)
The same understanding of natural systems would direct the dispersed cities in the developed world. In both worlds, the result would lead to a better integration of cities with the forces of nature. This concern for the integration of natural processes into city design will surface again in other chapters of this book.
The second major theme of the book relates city form to human experience. The comparison of city maps in this chapter helps us reflect on the quality of life in cities. The primary urban resource, the amount of space available to each individual, is stunningly variant. The comparison between the maps should not lead us to the conclusion that more space equals a higher or better quality of life; rather, we should conclude that land is a precious resource, to be used deliberately and not to be wasted.
At first disbelief sets in when the maps of the San Francisco Bay Area are shown next to Hong Kong, and next to a map of the Randstad, the urban concentration in The Netherlands that forms a ring and includes Amsterdam, Utrecht, The Hague, and Rotterdam. The comparison suggests that all inhabitants of the San Francisco Bay Area could live together in Sausalito and the urbanized areas of a small county to the north of San Francisco under conditions Bay Area residents would find extremely uncongenial, that is, if they were to live on the same land area and at the same density as the seven million people of Hong Kong. The rest of the Bay Area would be unpopulated. When shown to Bay Area residents the comparison produces a sense of shock and disbelief. All three maps were reproduced at the same graphic scale; all three show urbanized regions that accommodate nearly the same number of inhabitants, seven million people. The comparison is made possible by computing the surface of each of the three urbanized areas and expressing it as a percentage of a fifty by fifty kilometer square.
In the year 2000 when this collection of maps was started, the population of the San Francisco Bay Area was approaching seven million people and covered 83.75 percent of such a square; Hong Kong has since exceeded seven million inhabitants, but it still covers only 6 percent of a fifty by fifty kilometer square, whereas the Randstad in The Netherlands with its 6.6 million covers 42.7 percent of the same size square. Cities in different cultures with relatively equal numbers of inhabitants accommodate people at strikingly different densities. The conditions associated with the high density of Hong Kong are quickly explained. They are chiefly related to history, the influx of refugees from mainland China, and the political status of the former British colony. But the reasons for the high density are also explained by reflecting on Hong Kong’s topography. Most of the available and buildable land area is urbanized. The same is true for the San Francisco Bay Area; topography defines the extent of urbanization. Since the Bay Area has so much more buildable land, it is used at a dramatically different density. The Randstad on the other hand makes for a different comparison; the Rhine–Meuse–Scheldt Delta has much open land available, but by comparison the cities of this urbanized region have only modestly expanded into the agricultural land. The collective political will has limited the extent of the urbanization. Historically, all land above water was precious and had to be protected from flooding. As a result, residents here have lived at relatively high densities because they have also lived in settlement patterns barely at sealevel, frequently below.
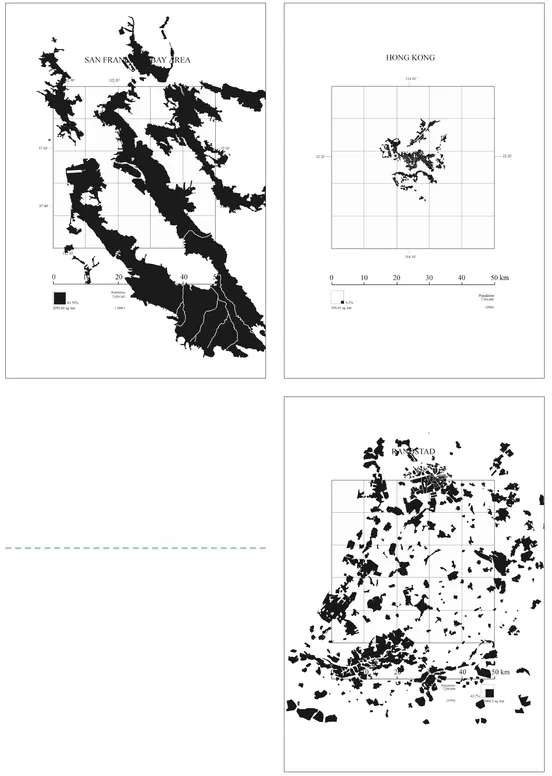
Figure 1.4 San Francisco Bay Area from satellite data recorded in April 2007. A solid loop has formed around the San Francisco Bay that includes—in addition to San Francisco—the major cities of San Jose in the south and Oakland to the east. (Courtesy NPA Satellite Mapping)
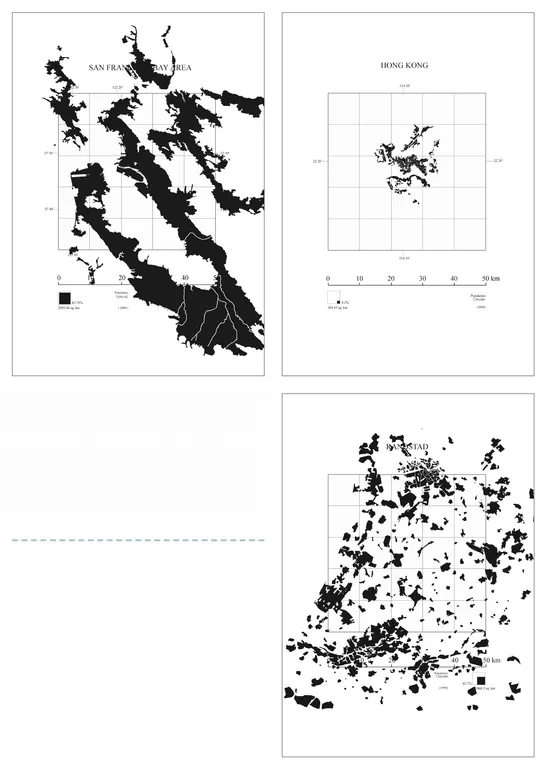
Figure 1.5 San Francisco Bay Area (top) compared to Hong Kong (top right) and the Randstad (right). The three maps were reproduced at the same graphic scale; all three show urbanized regions that accommodate nearly the same number of inhabitants, seven million people. The comparison is made possible by computing the surface of each of the three urbanized areas and expressing it as a percentage of a fifty by fifty kilometer square.
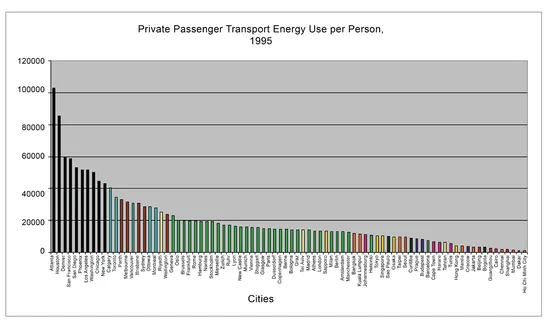
Figure 1.6 Per capita energy consumption for private vehicles in the world’s largest cities, 1995. (Courtesy Jeff Kenworthy and Peter Newman, Global City Data Base, CUSP Institute, Curtin University, Perth, Australia)
It is fair to conclude from the comparison of the three urban regions that human tolerance for density varies significantly, but the metrics of density as they relate to human ecology are not very well understood. Thus the comparisons between available space in cities a...
Table of contents
- About Island Press
- Title Page
- Copyright Page
- Table of Contents
- Table of Figures
- Acknowledgments
- Dedication
- Introduction
- CHAPTER ONE - To Compare
- CHAPTER TWO - To Observe
- CHAPTER THREE - To Measure
- CHAPTER FOUR - To Transform
- CHAPTER FIVE - To Define
- CHAPTER SIX - To Model
- CHAPTER SEVEN - To Interpret
- Conclusion
- Notes
- Bibliography
- Index
- Island Press Board of Directors
Frequently asked questions
Yes, you can cancel anytime from the Subscription tab in your account settings on the Perlego website. Your subscription will stay active until the end of your current billing period. Learn how to cancel your subscription
No, books cannot be downloaded as external files, such as PDFs, for use outside of Perlego. However, you can download books within the Perlego app for offline reading on mobile or tablet. Learn how to download books offline
Perlego offers two plans: Essential and Complete
- Essential is ideal for learners and professionals who enjoy exploring a wide range of subjects. Access the Essential Library with 800,000+ trusted titles and best-sellers across business, personal growth, and the humanities. Includes unlimited reading time and Standard Read Aloud voice.
- Complete: Perfect for advanced learners and researchers needing full, unrestricted access. Unlock 1.5M+ books across hundreds of subjects, including academic and specialized titles. The Complete Plan also includes advanced features like Premium Read Aloud and Research Assistant.
We are an online textbook subscription service, where you can get access to an entire online library for less than the price of a single book per month. With over 1.5 million books across 990+ topics, we’ve got you covered! Learn about our mission
Look out for the read-aloud symbol on your next book to see if you can listen to it. The read-aloud tool reads text aloud for you, highlighting the text as it is being read. You can pause it, speed it up and slow it down. Learn more about Read Aloud
Yes! You can use the Perlego app on both iOS and Android devices to read anytime, anywhere — even offline. Perfect for commutes or when you’re on the go.
Please note we cannot support devices running on iOS 13 and Android 7 or earlier. Learn more about using the app
Please note we cannot support devices running on iOS 13 and Android 7 or earlier. Learn more about using the app
Yes, you can access Urban Transformation by Peter Bosselmann in PDF and/or ePUB format, as well as other popular books in Architecture & Architecture General. We have over 1.5 million books available in our catalogue for you to explore.