![]()
1 Introduction
You may be holding this book and thinking, ‘why, oh why, do I have to study statistics? I am so bad at mathematics, it makes me so anxious, I just don’t want anything to do with numbers.’ You may especially be feeling like this if you are doing a humanities-based subject, sociology for example. You wanted to study sociology because you’re interested in people, society, and how different groups of people interact. You did not want to look at means, standard deviations or statistical tests.
If any of the above resonates with you, don’t worry – you are not alone. I have heard many students say something along these lines, even students doing science who perhaps should not be as surprised to have to do some sort of calculations. The good thing is that doing statistics at an introductory level does not actually require high-level mathematical skills. The two subjects are very different, so try not to think about them as the same thing. We live in an increasingly digitised world, data is all around us, and we are bombarded with it from all sides. Being able to talk about data, even at a descriptive level, can really help you explain a variety of social science and science based contexts.
I myself was terrible at maths in high school. When I took maths at an advanced level at age 16–18, I found it so frustrating, I just didn’t get it. I’d rattle my brain for hours, getting worked up and at times really upset. When I started my undergraduate degree (biology) I knew that I’d come across maths again, and rather than get myself worked up about it I started to change my attitude. I’d have conversations in my head along the lines of, ‘hey, maths, I don’t like you and you don’t like me – but I need you in order to become a scientist’. So, I changed my attitude, which made a big difference to the maths papers I took in my first year. I ended up with A’s – which I never thought I would achieve. And I can tell you now, this helped build my confidence to engage with the quantitative elements of my degree. Then I started doing more and more statistics, which I began to love, especially the critical thinking required to ask meaningful questions about data. My hope is that this book will help you to see the value of maths and eventually statistics, to explore data and also to understand your own discipline better.
Data is everywhere! It is an important part of everyone’s lives. We see it in the news, social media, on our smart phones and in our emails. As our lives become increasingly digitised, being able to make sense of data becomes vital, not only to study the world around us, but to live in it as well! Quantitative methods in sociology, psychology, biology and other subject areas are becoming increasingly important skills to master.
This book aims to help you pick up essential mathematics skills so as to be able to explore data confidently, helping you to develop an inquisitive nature about data. The book is structured to introduce you to the chapter topics and give you an overview of what will be covered in each chapter. On this data journey, you will come across a series of case studies, which include real data from a variety of social science, biological and humanities-type data sets. As you work through the book, you should find your confidence builds as you become better able to deal with numbers. You will also develop your own critical thinking skills, which will help you to decide how to present data in different ways, along with the advantages and disadvantages of the presentations you have selected. The book is full of questions to help you get to grips with each chapter’s content, and you can test yourself further by answering multiple choice questions on the accompanying website. There are also many self-directed activities, which encourage you to collect your own data and then think about the best way to present it. This is a hands-on book that was specifically created so that you can write your answers to these questions and activities in it.
Most statistics books for humanities students, especially students studying social sciences, start at too high a level. This makes them inaccessible for many students, which can add to their own anxiety. This book starts off by covering essential maths skills, and as you progress through the chapters you will notice that they build on each other. Questions will appear in later chapters that may test skills developed in previous chapters, to ensure that you are retaining these skills and practising them. This will also help you to see where everything fits together
The chapters are arranged in a similar format, starting with an outline of the skills being developed. The types of questions and resources being used in each chapter are then described, with links for you to be able to access the data sets being used. Common areas and tips to remember are included, with the case studies forming the bulk of each chapter. The questions linked to each chapter will help you build your knowledge and confidence in using statistics. Critical thinking development is also incorporated throughout the book – this is an essential skill to help you make sense of the data being presented.
Chapters 2–4 look at the essential mathematical skills required to explore data confidently. The multitude of questions included in these chapters will help you to hone your skills in being able to round numbers off to a certain number of decimal places, change between ratios, proportions and percentages, and also add, subtract, divide and multiply numbers. There is also a section on inequalities in Chapter 3, which will help you to compare two numbers and decide if one is bigger or smaller than the other.
Chapter 5 gets you to think more deeply about how tables are arranged, and about their structure and purposes. Chapter 6 introduces you to statistics, where you will begin to explore how to identify different types of data. Chapter 7 moves on to different ways of displaying data in a graph, including the key features of the main types of graph available for displaying different kinds of data. Chapter 8 begins to focus all the skills you have picked up throughout the book, and starts exploring descriptive data in more depth, helping to develop your critical thinking skills.
Chapters 9 and 10 introduce you to different ways in which we collect data, the reason why we use certain techniques, along with the advantages and disadvantages of using a variety of methods. It is envisaged that many of you will at some point in your studies have to think about creating a survey, or collecting some sort of observational data. So these chapters will get you to think about where you could take the next steps on your data exploration journey.
The data sets used in this book are in CSV or Excel format, which means you will be able to continue exploring them using other software such as SPSS, R or iNZight. Just a word of caution: some of the data sets are large, so be patient when waiting for them to download. Everything you will see in this book is sourced from real data from around the world, which may require you to think about cultural explanations that could explain the data presented. To ensure that you can keep practising your skills, there are additionally a series of online questions and activities linked to the data sets covered in the book.
Rest assured, you are in safe hands with this book. It was designed specifically for students who lack confidence in mathematics or statistics, or for students who feel they need to brush up on their skills in these areas. Good luck, and make sure you keep practising the skills you develop in this book.
Note: an initial capital letter is used to denote a variable and, also, the levels in each variable.
![]()
2 Essential Numeracy
Skills in this chapter
The first part of our data journey will involve developing essential numeracy skills, which will enable you to explore data more confidently. Numeracy skills are vital to analyse quantitative data (working with quantities). Essential numeracy skills include the ability to identify which values are the highest and smallest in a data set. The ability to subtract and add values together, which can change the values within a data set and change the order of the highest and smallest values, is also important. Being able to multiply and divide numbers is a core skill as well, needed especially when calculating percentages and proportions. Chapters 3 and 4 will build on using these skills, to aid in calculating percentages, ratios and proportions.
The essential numeracy skills included in this book are:
Addition: 5 + 4 = 9
Subtraction: 5 – 4 = 1, 4 – 5 = –1
Multiplication: 3 × 5 = 15, 5 × 0.25 = 1.25
Division: 9/10 = 0.9, 10/10 = 1, 150/10 = 15
Types of question in this chapter
This chapter presents a series of data sets, with questions aimed at developing the essential numeracy skills stated above. A series of short-answer questions accompany the case studies presented.
Resources to support this chapter
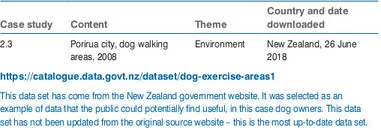
The data sets used in this chapter come from UK and New Zealand government websites (see below). Table 2.1 contains an extract from a UK data set, with several Licensing authorities removed; Table 2.2 contains the full data set. Several of the column headings in Table 2.3 were renamed to make them easier to interpret.
...