The R language is widely used by statisticians for data analysis, and the popularity of R programming has therefore increased substantially in recent years. The emerging Internet of Things (IoT) gathers increasing amounts of data that can be analyzed to gain useful insights into trends. R for Data Analysis in easy stepshas an easy-to-follow style that will appeal to anyone who wants to produce graphic visualizations to gain insights from gathered data. R for Data Analysis in easy stepsbegins by explaining core programming principles of the R programming language, which stores data in "vectors" from which simple graphs can be plotted. Next, the book describes how to create "matrices" to store and manipulate data from which graphs can be plotted to provide better insights. This book then demonstrates how to create "data frames" from imported data sets, and how to employ the "Grammar of Graphics" to produce advanced visualizations that can best illustrate useful insights from your data. R for Data Analysis in easy stepscontains separate chapters on the major features of the R programming language. There are complete example programs that demonstrate how to create Line graphs, Bar charts, Histograms, Scatter graphs, Box plots, and more. The code for each R script is listed, together with screenshots that illustrate the actual output when that script has been executed. The free, downloadable example R code is provided for clearer understanding. By the end of this book you will have gained a sound understanding of R programming, and be able to write your own scripts that can be executed to produce graphic visualizations for data analysis. You need have no previous knowledge of any programming language, so it's ideal for the newcomer to computer programming.

- English
- ePUB (mobile friendly)
- Available on iOS & Android
eBook - ePub
About this book
Trusted by 375,005 students
Access to over 1.5 million titles for a fair monthly price.
Study more efficiently using our study tools.
Information
1
Getting started
Welcome to the exciting world of R programming. This chapter describes how to set up an R environment and demonstrates how to create a first R program.
Understanding data
Installing R
Installing RStudio
Exploring RStudio
Setting preferences
Creating an R Script
Summary
Understanding data
The term “data” refers to items of information that describe a (qualitative) status or a (quantitative) measure of magnitude. Various types of data is collected from a huge range of sources and reported for analysis to reveal pattern and trend insights:
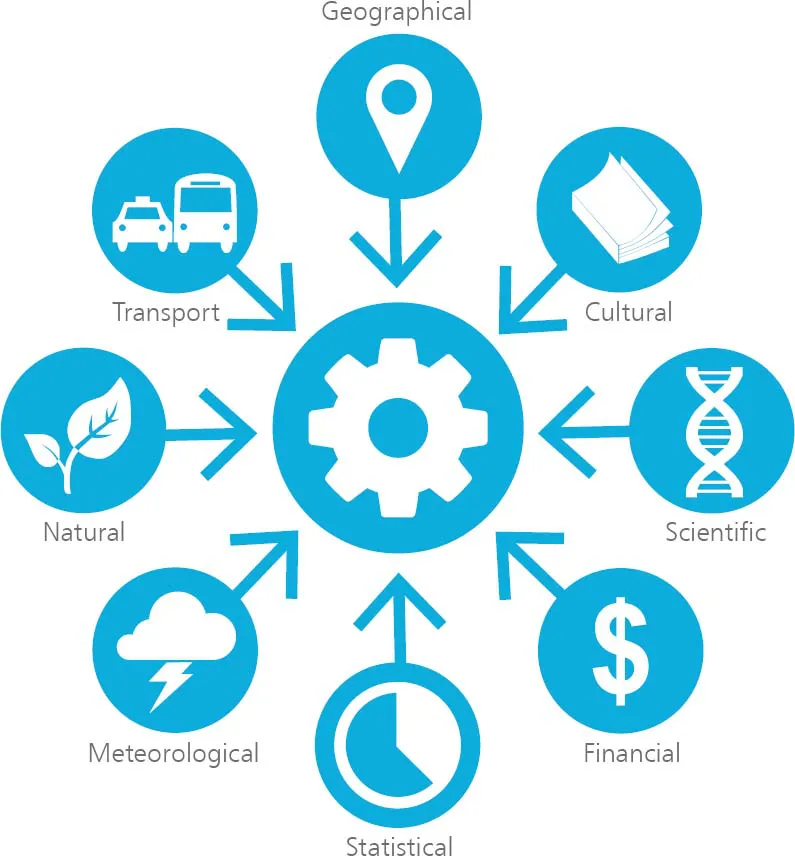

This illustration depicts only some of the many data types that can be reported for analysis.
Data is increasingly being collected by devices that are able to report measurements for analysis via the internet (“The Cloud”). For example, devices that have temperature and humidity sensors can report measurements for instant analysis of climate conditions. The recent rapid decline in the cost of device sensors has given rise to the “Internet of Things” (IoT) that can easily and cheaply report vast amounts of data – this is often referred to as “big data”. Big data consists of extremely large data sets that can best be analyzed by computer to reveal pattern and trend insights.

Around 13 billion devices are connected to the internet today. This is predicted to grow to 50 billion by 2020.
Data analysis (a.k.a. “data analytics”) is the practice of converting collected data into information that is useful for decision-making. The collected “raw” data will, however, typically undergo two initial procedures before it can be explored for insights:
•Data processing – the raw data must be organized into a structured format. For example, it may be arranged into rows and columns in a table format for use in a spreadsheet.
•Data cleaning – the organized data must be stripped of incomplete, duplicated, and erroneous items. For, example, by the removal of duplicated rows in a spreadsheet.
“Data Science” is the study of how data can be turned into a valuable resource.
After the data has been processed and cleaned it can be explored to discover its main characteristics. This may require further data cleaning to refine the data to specific areas of interest, or may require additional data to better understand its messages. Descriptive statistics, such as average values, might be calculated to understand the data. Algorithms might be used to identify associations within the data. Data visualization might also be used to produce a graph...
Table of contents
- Cover
- Title
- Copyright
- Contents
- Preface
- 1 Getting started
- 2 Storing values
- 3 Performing operations
- 4 Testing conditions
- 5 Employing functions
- 6 Building matrices
- 7 Constructing data frames
- 8 Producing quick plots
- 9 Storytelling with data
- 10 Plotting perfection
- Back Cover
Frequently asked questions
Yes, you can cancel anytime from the Subscription tab in your account settings on the Perlego website. Your subscription will stay active until the end of your current billing period. Learn how to cancel your subscription
No, books cannot be downloaded as external files, such as PDFs, for use outside of Perlego. However, you can download books within the Perlego app for offline reading on mobile or tablet. Learn how to download books offline
Perlego offers two plans: Essential and Complete
- Essential is ideal for learners and professionals who enjoy exploring a wide range of subjects. Access the Essential Library with 800,000+ trusted titles and best-sellers across business, personal growth, and the humanities. Includes unlimited reading time and Standard Read Aloud voice.
- Complete: Perfect for advanced learners and researchers needing full, unrestricted access. Unlock 1.5M+ books across hundreds of subjects, including academic and specialized titles. The Complete Plan also includes advanced features like Premium Read Aloud and Research Assistant.
We are an online textbook subscription service, where you can get access to an entire online library for less than the price of a single book per month. With over 1.5 million books across 990+ topics, we’ve got you covered! Learn about our mission
Look out for the read-aloud symbol on your next book to see if you can listen to it. The read-aloud tool reads text aloud for you, highlighting the text as it is being read. You can pause it, speed it up and slow it down. Learn more about Read Aloud
Yes! You can use the Perlego app on both iOS and Android devices to read anytime, anywhere — even offline. Perfect for commutes or when you’re on the go.
Please note we cannot support devices running on iOS 13 and Android 7 or earlier. Learn more about using the app
Please note we cannot support devices running on iOS 13 and Android 7 or earlier. Learn more about using the app
Yes, you can access R for Data Analysis in easy steps by Mike McGrath in PDF and/or ePUB format, as well as other popular books in Computer Science & Programming Languages. We have over 1.5 million books available in our catalogue for you to explore.