Many deny that racism remains pervasive in America today. How can we open eyes to the continuing disadvantages that keep many people of color from fulfilling their potential, and having an equal chance to achieve the "American Dream"?By presenting the impact of racism on the most innocent and powerless members of society– children of color – in the form of statistics, this book aims to change attitudes and perceptions. Children have no say about where they are born or what school they attend. They have no control over whether or not they get medical treatment when they fall ill. They can't avoid exposure if their home is in a community blighted by pollution. The questions this book poses are: What responsibility do we expect children to take for their life circumstances? Do those conditions blight their futures? If they aren't responsible, who is? Are some in society privileged and complicit in denying people of color the advantages and protections from harm most of us take for granted? Through the cumulative effect of official statistics rather than the more usual reliance on anecdote – by taking a "show me the numbers!" approach – this book will open minds, start conversations, and even prompt readers to take action. While the numbers are official they are often hard to find because they are scattered across so many sources. Art Munin has not only done the research, but shows the reader how to locate data on racial and socio-economic disparities, and develop her or his own case or classroom project. Color by Number takes as its metaphorical point of departure the familiar children's activity of that name. Art Munin has painstakingly researched and gathered the numbers, and has filled in the spaces to reveal the hidden picture of racism in America from the perspectives of health, the environment, the law, and education.This book is intended as a fact-based, antiracism text for diversity and social justice courses, and as a resource for diversity and social justice educators as they craft their race, racism, and White privilege curricula. Art Munin's multidisciplinary approach – drawing on scholarly work from medicine, law, sociology, psychology, and education – provides the reader with a comprehensive way to understand the pervasiveness of racism.
- 132 pages
- English
- ePUB (mobile friendly)
- Available on iOS & Android
eBook - ePub
About this book
Trusted by 375,005 students
Access to over 1.5 million titles for a fair monthly price.
Study more efficiently using our study tools.
Information
Topic
EducationSubtopic
Education Theory & Practice1
Setting the Stage
THIS IS NOT THE BOOK I WANTED TO WRITE, BUT one that is necessary. I believe racism exists as a chronic and pervasive facet of life, as a factor that privileges Whites while oppressing people of color, and as a definitive barrier to growth and advancement for all of society. However, it is a sad reality that diversity and social justice educators must still devote significant time and energy to proving racism exists. Since electing President Obama into the Oval Office, the idea of a postrace society has grown in popularity. The argument is that President Obama’s success indicates that race is not the impediment to advancement it once was. This is false; the success of one man does not undo a system as historically entrenched as racism.
Racism touches every iota of our existence, covertly and overtly. It is normalized and woven into the fabric of our lives, so much so that it is difficult to envision life without it. This is why it is increasingly important to question, seek answers, and report the truth about racist practices in our society. That is the mission of this book. It is a manual for those who wish to educate about racism and advocate for change. However, to do this work, it is vital to be armed appropriately.
In an increasingly data-driven world, we are required to show proof that a problem exists before we can discuss a solution. Those in positions of power are often influenced by only one type of proof—quantitative. Or, in other words—“Show me the numbers!” Though statistics can clear pathways, open doors, and trigger conversations, in my experience, social justice advocates and diversity educators are not adept at deploying this type of information. Those of us who do this work, myself included, are more practiced at using the stories of real people to exemplify oppression or privilege. These stories bring racism to life and have the power to bring much-needed authenticity to discussion of this topic. But, however powerful, stories are no substitute for data.
To kick down the door for people who are skeptical about the effects of racism, educators must be knowledgeable about the underlying facts and stats. Without these data, it is too easy to dismiss the pursuit of social justice as the work of bleeding-heart liberals. Winston Churchill once said, “If you’re not a liberal at twenty you have no heart, if you’re not a conservative at forty you have no brain.” The implication is that being liberal is fashionable when we are young and uninformed. At such a stage, we follow our hearts and passions and display the rebelliousness of youth. However, as we get older and learn how the world really works, it will become increasingly clear that the liberal agenda does not make sense. The conservatives are the ones who use the full power of their minds.
The presumption of Churchill’s quote is that the liberal agenda for justice is devoid of facts and cannot be supported by rational arguments. This is, of course, untrue. I concede that liberals have not effectively used all the tools at our disposal. There are logical, fact-based arguments that prove the destructiveness of racism and its effect on society. These facts and stats are a powerful and necessary tool. Educators must teach in a way that best promotes student learning, not in the manner the teacher is most comfortable. This book compiles the objective facts and established statistics on racism to make evidence-based, research-driven arguments that illustrate its chronic and pervasive nature.
Part of the reason it has been difficult to use this information is because it is scattered everywhere. This is where the symbolism of Color by Number becomes clear. When I was younger I loved the “color by number” games in the comics section of the Sunday newspaper. The numbers were inside an assortment of adjoined geometrical shapes that appeared to be scattered randomly. However, among this confluence of shapes was a picture. My job was to color each number the appropriate color. I would make all the number ones purple and color the shapes with a number two in green. I did this until I filled every numbered field with the appropriate color, revealing the previously indecipherable picture. I would often try to guess what the picture would be, but I could only tell once I stood back to look at my completed handiwork.
Social justice work is very similar to this game in that it remains largely sequestered. We rarely bring together the diverse social justice research that has been done in fields including education, medicine, law, history, sociology, and psychology, and this prevents us from connecting the varying colors and shapes to see what greater image emerges. When taken together, this work provides a comprehensive picture of the centrality of race and the effects of racism throughout our society, whether in educational institutions, health-care organizations, or the criminal justice system. There is a plethora of misinformation attempting to debunk the arguments put forth in this book. As such, it is vital to draw together the research, facts, and statistics that illustrate the somber reality of being born a person of color in the United States.
The title of this book has a secondary meaning as well. Just as “color by number” activities are directed toward children, this book and the research that drives it focus on how racism affects children of color in the United States. Children are a protected class in society due to their innocence and powerlessness. Children have no say about where they are born, what school they will attend, whether they will receive a doctor’s treatment when sick, or what pollutants they will inhale or ingest. Children have few, if any, choices. Yet, we live by the myth of meritocracy in the United States, believing that every person’s social location is a product of his or her work. To put it another way, “You get out what you put in.” Is it fair to expect children to take responsibility for the circumstances of their lives? That is one of the major questions this book addresses.
We all bear responsibility for the racism children of color experience. The material that follows is a stark reminder that we are not in a meritocracy. People do not simply get what they earn or reap what they sow; we live in a plutocracy in which those at the bottom experience great challenges and difficulties, allowing for few successes. I say few because our capitalist system does enable some people with exceptional skills and pertinacity to succeed, disguising the underlying fact that there is little social mobility in the United States. This illusion enables those on top to look down on the lower classes and blame them for their lot in life. However, any success story is more akin to winning the lottery than simply to pulling up on some bootstraps.
The argument I put forth in this book is not the obvious one for me. My life’s work is with adults—not children. Adults of color are trapped in the same system that grips their children. However, like a district attorney looking at a winnable case versus a morally justified one, sometimes we need to make the argument we can win as opposed to the argument we truly desire. With the United States deeply invested in the mythology of meritocracy, it is easy to dismiss justice arguments on behalf of adults. However, in the case of children, the meritocracy argument does not hold up. The research presented throughout this book strongly illustrates the chronic and pervasive racism that children of color face in their formative years, and the very negative effect it has on their lives.
HOW I DID IT
For each chapter, I performed a multidisciplinary search of the relevant literature. For some chapters, such as “Preventing Medicine: Health-Care Access,” much of the information came from medical journals. For others, such as “Criminals or Children?: Juvenile Justice,” the research stemmed primarily from the legal field. For every subject, I was able to identify a plethora of data compiled by researchers in a wide range of disciplines, including psychology, sociology, and education. Regardless of the field from which the academic inquiry stemmed, the results were more similar than not. Finally, I’ve included data reported by various government agencies. To its credit, the U.S. government compiles an incredible amount of information and posts it freely on various websites.
I made every attempt to make this a truly contemporary review of the research for each subject. The search parameters were not to accept anything published before the year 2000. However, at times I violated this rule because some topics have not been subject to large amounts of research.
Another reason for setting the search parameters in this way was to account for the incredible lag time between conducting research and publishing. Under the best-case scenario, it may take researchers a year or more to collect data for a study. Conservatively, the writing process may take another year. It can then take another year or more for the research to appear in published form. It is not unusual for an article printed in the year 2000 to be the result of research collected in 1996, and there are cases when the data are even older.
BY THE NUMBERS
I have always found statistics to be far easier to comprehend than any other form of math. Statistics have a story associated with them. When I was younger and was given a generic algebra equation to solve, my first thought would be, “And why do I care?” The number I found seemed meaningless, with no obvious relationship to the real world against which I could test it. My academic work in statistics changed all of that. When looking at statistical data from a research project, I understood the why behind the numbers. When I found an answer to a statistics problem, I could look back at the story of the problem to see if it made any sense.
The research I collected for this book presented a wide variety of statistical measures. However, I purposefully used data that readers would intuitively understand and that did not require specialist knowledge. For instance, if an article presented a test score stating one group earned a 132 and another 154, that difference might be meaningful. But I often excluded such cases because, unless you actually knew what the test measured and how those scores lined up against the whole population, they are useless. I could have gone into extensive detail in every one of these cases to analyze the meaning, but I feared such a step would drastically diminish the functionality and readability of this book. Instead, I chose to create easily decipherable tables and figures and clearly explain their meaning in the text. My hope is that this will allow readers to flip to any section of the book, look at a table or figure, and, by reading a short paragraph, know exactly what the data means. My only noteworthy departure resides in my coverage of standardized testing in schools in which I describe fully the nature and norms of those assessments. The types of statistics found in this book are described in the following paragraphs.
Percentages
Percentages are used as frequently as they are misinterpreted. They are numbers used to identify a proportion of a population (McCall, 1994). For instance, in 2008, the estimated population of the United States was 304,059,724 (U.S. Census Bureau, 2009). This large number tells us the size of this country, but does not describe the people. One descriptor that is often used is race; Table 1.1 includes the estimated raw numbers for racial groups in the United States as of 2008.
TABLE 1.1
United States Estimated Population Using Raw Numbers, 2008 (U.S. Census Bureau, 2009)
United States Estimated Population Using Raw Numbers, 2008 (U.S. Census Bureau, 2009)
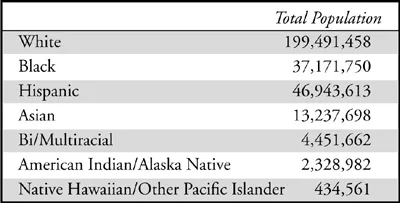
These numbers tell a story about race in the United States, but they are difficult to understand. We can easily see that Whites constitute a larger share of the population, but it is more difficult to decipher their proportion in comparison to the whole country. The percentage breakdown in Table 1.2 makes these data much easier to manage.
TABLE 1.2
United States Estimated Population Using Percentages, 2008 (U.S. Census Bureau, 2009)
United States Estimated Population Using Percentages, 2008 (U.S. Census Bureau, 2009)
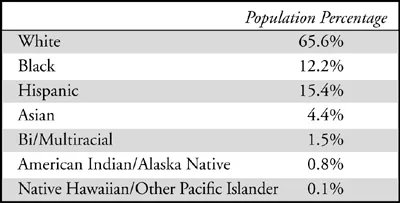
These statistics are descriptive and useful. They describe the makeup of the country as it pertains to these groups without weighing us down with the large raw numbers for each population. Another way to view these data is a pie chart, as depicted in Figure 1.1.
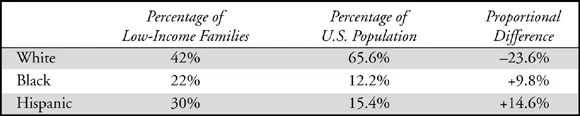
Now that these percentages have given us a baseline understanding of a population under investigation, other percentages can tell a story. For instance, it was estimated in 2008 that the United States had 13,412,000 low-income families. Blacks constituted 22% of this population, Hispanics 30%, and Whites 42% (Simms, Fortuny, & Henderson, 2009). Merely glancing at these data, we can rightly infer that there are nearly twice as many Whites in low-income families than there are Blacks. If one were to stop at this deduction, one would be left with an incomplete, even misleading, impression. In the case of low-income families, there may be twice as many Whites as Blacks, but according to the U.S. Census Bureau data (2009), Whites constitute a much larger percentage of the overall population. Table 1.3 illuminates this discrepancy.
In an equitable society, if Whites constitute 65.6% of the total population, they should also make up 65.6% of those in the low-income bracket. But this group is actually 23.6 percentage points lower in representation in the low-income family category. Conversely, Blacks make up a larger percentage than their overall size in the low-income population by 9.8 percentage points. The same is true for Hispanics, who constitute a greater share of the low-income group compared to their population size by 14.6 percentage points. The key word here is disproportionate. Whites are underrepresented while Blacks and Hispanics are overrepresented in low-income families, leading to a disproportionate number of Blacks and Hispanics experiencing this social plight. Another way of representing this data is in a bar chart, as shown in Figure 1.2.
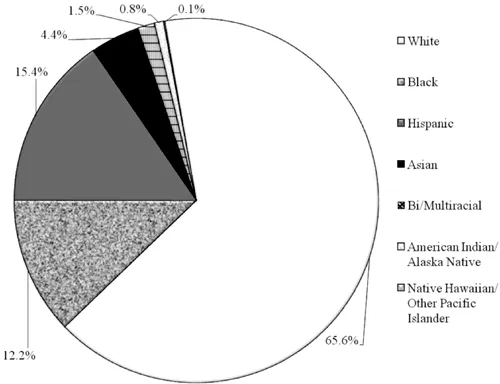
Figure 1.1 United States Estimated Population Using a Pie Chart, 2008
(U.S. Census Bureau, 2009)
TABLE 1.3
United States Low-Income Families and Race, Percentages (Simms et al., 2009; U.S. Census Bureau, 2009)
United States Low-Income Families and Race, Percentages (Simms et al., 2009; U.S. Census Bureau, 2009)
The innu...
Table of contents
- Cover Page
- Title Page
- Copyright Page
- Dedication
- Contents
- Acknowledgments
- Foreword
- 1 Setting the Stage
- 2 Preventing Medicine: Health-Care Access
- 3 Race, Space, and Place: Environmental Justice
- 4 Criminals or Children?: Juvenile Justice
- 5 Back of the School Bus: K–12 Education
- 6 The Leaky Pipeline: Access to Higher Education
- 7 Next Steps as a Social Change Agent
- About the Author
- Index
Frequently asked questions
Yes, you can cancel anytime from the Subscription tab in your account settings on the Perlego website. Your subscription will stay active until the end of your current billing period. Learn how to cancel your subscription
No, books cannot be downloaded as external files, such as PDFs, for use outside of Perlego. However, you can download books within the Perlego app for offline reading on mobile or tablet. Learn how to download books offline
Perlego offers two plans: Essential and Complete
- Essential is ideal for learners and professionals who enjoy exploring a wide range of subjects. Access the Essential Library with 800,000+ trusted titles and best-sellers across business, personal growth, and the humanities. Includes unlimited reading time and Standard Read Aloud voice.
- Complete: Perfect for advanced learners and researchers needing full, unrestricted access. Unlock 1.5M+ books across hundreds of subjects, including academic and specialized titles. The Complete Plan also includes advanced features like Premium Read Aloud and Research Assistant.
We are an online textbook subscription service, where you can get access to an entire online library for less than the price of a single book per month. With over 1.5 million books across 990+ topics, we’ve got you covered! Learn about our mission
Look out for the read-aloud symbol on your next book to see if you can listen to it. The read-aloud tool reads text aloud for you, highlighting the text as it is being read. You can pause it, speed it up and slow it down. Learn more about Read Aloud
Yes! You can use the Perlego app on both iOS and Android devices to read anytime, anywhere — even offline. Perfect for commutes or when you’re on the go.
Please note we cannot support devices running on iOS 13 and Android 7 or earlier. Learn more about using the app
Please note we cannot support devices running on iOS 13 and Android 7 or earlier. Learn more about using the app
Yes, you can access Color by Number by Art Munin in PDF and/or ePUB format, as well as other popular books in Education & Education Theory & Practice. We have over 1.5 million books available in our catalogue for you to explore.