This book is a fresh approach to a calculus based, first course in probability and statistics, using R throughout to give a central role to data and simulation.
The book introduces probability with Monte Carlo simulation as an essential tool. Simulation makes challenging probability questions quickly accessible and easily understandable. Mathematical approaches are included, using calculus when appropriate, but are always connected to experimental computations.
Using R and simulation gives a nuanced understanding of statistical inference. The impact of departure from assumptions in statistical tests is emphasized, quantified using simulations, and demonstrated with real data. The book compares parametric and non-parametric methods through simulation, allowing for a thorough investigation of testing error and power. The text builds R skills from the outset, allowing modern methods of resampling and cross validation to be introduced along with traditional statistical techniques.
Fifty-two data sets are included in the complementary R package fosdata. Most of these data sets are from recently published papers, so that you are working with current, real data, which is often large and messy. Two central chapters use powerful tidyverse tools (dplyr, ggplot2, tidyr, stringr) to wrangle data and produce meaningful visualizations. Preliminary versions of the book have been used for five semesters at Saint Louis University, and the majority of the more than 400 exercises have been classroom tested.
The exercises in the book have been added to to the free and open online homework system myopenmath (https://www.myopenmath.com/) which may be useful to instructors.
Trusted by 375,005 students
Access to over 1.5 million titles for a fair monthly price.
The R Statistical Programming Language plays a central role in this book. While there are several other programming languages and software packages that do similar things, we chose R for several reasons:
R is widely used among statisticians, especially academic statisticians. If there is a new statistical procedure developed somewhere in academia, chances are that the code for it will be made available in R. This distinguishes R from, say, Python.
R is commonly used for statistical analyses in many disciplines. Other software, such as SPSS or SAS is also used and in some disciplines would be the primary choice for some discipline specific courses, but R is popular and its user base is growing.
R is free. You can install it and all optional packages on your computer at no cost. This is a big difference between R and SAS, SPSS, MATLAB, and most other statistical software.
R has been experiencing a renaissance. With the advent of the tidyverse and RStudio, R is a vibrant and growing community. We also have found the community to be extremely welcoming. The R ecosystem is one of its strengths.
In this chapter, we will begin to see some of the capabilities of R. We point out that R is a fully functional programming language, as well as being a statistical software package. We will only touch on the nuances of R as a programming language in this book.
1.1 Arithmetic and variable assignment
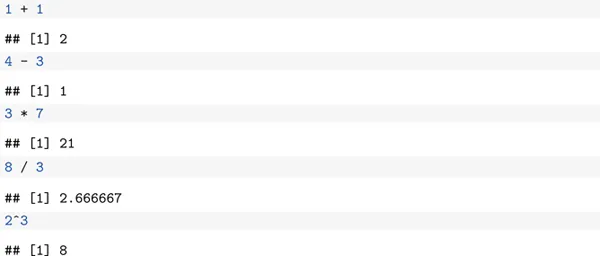
We begin by showing how R can be used as a calculator. Here is a table of commonly used arithmetic operators.
TABLE1.1:Basic arithmetic operators in R.
Operator
Description
Example
+
addition
1 + 1
-
subtraction
4 - 3
*
multiplication
3 * 7
/
division
8 / 3
^
exponentiation
2^3
The output of the examples in Table 1.1 is given below. Throughout the book, lines that start with ## indicate output from R commands. These will not show up when you type in the commands yourself. The [1] in the lines below indicate that there is one piece of output from the command. These will show up when you type in the commands.
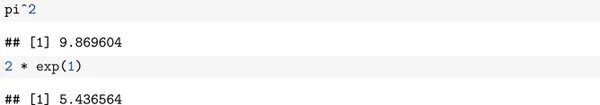
A couple of useful constants in R are pi and exp(1), which are and Here R a couple of examples of how you can use them.
R is a functional programming language. If you don't know what that means, that's OK, but as you might guess from the name, functions play a large role in R. We will see many, many functions throughout the book. Every time you see a new function, think about the following four questions:
What type of input does the function accept?
What does the function do?
What does the function return as output?
What are some typical examples of how to use the function?
In this section, we focus on functions that do things that you are likely already familiar with from your previous math courses.
We start with exp. The function exp takes one argument named x and returns ex. So, for example, exp(x = 1) will compute , as we saw above. In R, it is optional as to whether you supply the named version x = 1 or just 1 as the argument. So, it is equivalent to write exp(x = 1) or exp(1). Typically, for functions that are “well-known,” the first argument or two will be given without names, then the rest will be provided with their names. Our advice is that if in doubt, include the name.
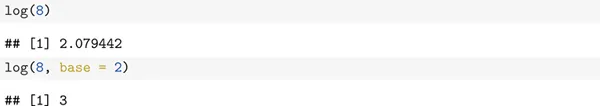
Next, we discuss the log function. The function log takes two arguments x and base and returns , where b is the base. The x argument is required. The base argument is optional with a default value of e. In other words, the default logarithm is the natural logarithm. Here are some examples of using exp and log.
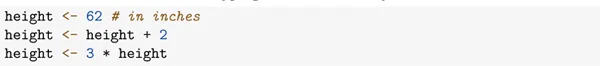
You can't get very far without storing results of your computations to variables! The way1 to do so is with the arrow < -. Typing Alt + - is the keyboard shortcut for < -.
The # in inches part of the code above is a comment. These are provided to give the reader information about what is going on in the R code, but are not executed and have no impact on the output.
If you want to see what value is stored in a variable, you can
type the variable name
look in the environment box in the upper right-hand corner of RStudio.
Use the str command. This command gives other useful information about the variable, in addition to its value.
This says that height contains num-eric data, and its current value is 192 (which is ...
Table of contents
Cover Page
Half-Title Page
Title Page
Copyright Page
Contents
Preface
1 Data in R
2 Probability
3 Discrete Random Variables
4 Continuous Random Variables
5 Simulation of Random Variables
6 Data Manipulation
7 Data Visualization with ggplot
8 Inference on the Mean
9 Rank Based Tests
10 Tabular Data
11 Simple Linear Regression
12 Analysis of Variance and Comparison of Multiple Groups
13 Multiple Regression
Image Credits
Index
Index of Data Sets and Packages
Frequently asked questions
Yes, you can cancel anytime from the Subscription tab in your account settings on the Perlego website. Your subscription will stay active until the end of your current billing period. Learn how to cancel your subscription
No, books cannot be downloaded as external files, such as PDFs, for use outside of Perlego. However, you can download books within the Perlego app for offline reading on mobile or tablet. Learn how to download books offline
Perlego offers two plans: Essential and Complete
Essential is ideal for learners and professionals who enjoy exploring a wide range of subjects. Access the Essential Library with 800,000+ trusted titles and best-sellers across business, personal growth, and the humanities. Includes unlimited reading time and Standard Read Aloud voice.
Complete: Perfect for advanced learners and researchers needing full, unrestricted access. Unlock 1.5M+ books across hundreds of subjects, including academic and specialized titles. The Complete Plan also includes advanced features like Premium Read Aloud and Research Assistant.
Both plans are available with monthly, semester, or annual billing cycles.
We are an online textbook subscription service, where you can get access to an entire online library for less than the price of a single book per month. With over 1.5 million books across 990+ topics, we’ve got you covered! Learn about our mission
Look out for the read-aloud symbol on your next book to see if you can listen to it. The read-aloud tool reads text aloud for you, highlighting the text as it is being read. You can pause it, speed it up and slow it down. Learn more about Read Aloud
Yes! You can use the Perlego app on both iOS and Android devices to read anytime, anywhere — even offline. Perfect for commutes or when you’re on the go. Please note we cannot support devices running on iOS 13 and Android 7 or earlier. Learn more about using the app
Yes, you can access Probability, Statistics, and Data by Darrin Speegle,Bryan Clair in PDF and/or ePUB format, as well as other popular books in Mathematics & Statistics for Business & Economics. We have over 1.5 million books available in our catalogue for you to explore.