
- 432 pages
- English
- ePUB (mobile friendly)
- Available on iOS & Android
eBook - ePub
Graphical Belief Modeling
About this book
This innovative volume explores graphical models using belief functions as a representation of uncertainty, offering an alternative approach to problems where probability proves inadequate. Graphical Belief Modeling makes it easy to compare the two approaches while evaluating their relative strengths and limitations. The author examines both theory and computation, incorporating practical notes from the author's own experience with the BELIEF software package. As one of the first volumes to apply the Dempster-Shafer belief functions to a practical model, a substantial portion of the book is devoted to a single example--calculating the reliability of a complex system. This special feature enables readers to gain a thorough understanding of the application of this methodology.
The first section provides a description of graphical belief models and probablistic graphical models that form an important subset: the second section discusses the algorithm used in the manipulation of graphical models: the final segment of the book offers a complete description of the risk assessment example, as well as the methodology used to describe it. Graphical Belief Modeling offers researchers and graduate students in artificial intelligence and statistics more than just a new approach to an old reliability task: it provides them with an invaluable illustration of the process of graphical belief modeling.
Tools to learn more effectively

Saving Books

Keyword Search

Annotating Text

Listen to it instead
Information
PART I
INTRODUCTION TO GRAPHICAL BELIEF MODELS
The tree of cliques has shed its leaves,
eliminated one by one,
And the semimartingale as it grieves,
sings for the loss of the sun….
But propagate not the fusion of thy heart,
lost forever in empirical glory
Lose not belief, though Winter dark,
and chance fields frozen and hoary.
CHAPTER 1
Overview of Graphical Belief Models
Life is uncertain, therefore good decision making requires building models to assess risk. Whether we are building a computer program for automatic decision making (artificial intelligence) or a model to assist a human decision maker, we are faced with the same problem: building a model to assess the risks of critical events. Often we must build these models from information that are incomplete and imprecise, in which case we must pay careful attention to our representation of uncertainty. This book describes the process of building and manipulating risk assessment models using two different representations of uncertainty: probability and belief functions (Dempster-Shafer theory of evidence).
One of the principal challenges in risk assessment is organizing all of the information in the model (as well as the knowledge that went into constructing it). For example, a probability or belief function model describing the chances of various failure states of a complex system involving 1,000 components will contain more than 1,000 variables describing component and subsystem states. Specifying and manipulating such a large model requires techniques that take advantage of structure in the problem.
Fortunately, such large models typically are composed of many smaller models. For example, a valve is usually connected to an actuator that controls its position. Although the direct interaction between a valve and its actuator is very important in the model, there is no direct interaction between a given valve and the actuator for a different valve, only secondary interactions through other systems (the control system or the valves’ output). Using these independence assumptions we can take advantage of the structure of the problem to produce a computationally tractable model.
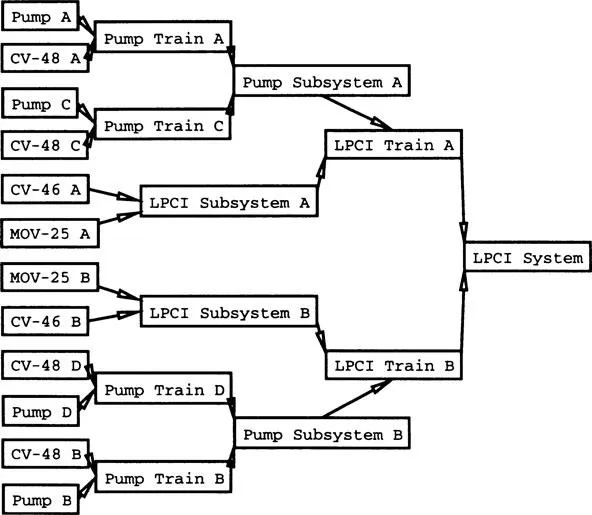
A graphical belief model uses a graph (such as that shown in Figure 1.1) to capture the structure of the problem. The model graph is both a mathematical structure—that specifies which variables are directly connected—and a picture that provides an intuitive description of the model. For example, Figure 1.1 describes a Low Pressure Coolant Injection system from a boiling water reactor (Martz and Waller [1990]). Even without knowing much about reactors it is clear that the states of Pump A and Check Valve-48 A influence the state of Pump Train A, and so forth through the graph. The graph is an incomplete description of the problem—it provides no information as to how the states of Pump A and Check Valve-48 A influence the state of Pump Train A—but it does indicate which influences are direct and which are indirect.
Graphical models are potentially powerful because they translate a complex problem into an easily understood form. The model graph provides a visual metaphor of the structure of a complex mathematical model. We can exploit that metaphor in both construction and calculation. The graph provides a natural mechanism for eliciting distributions from an expert. It supports techniques, such as the fusion and propagation algorithm for combining the information in complex ways. In short, the techniques of graphical models make large problems tractable.
The term belief in graphical belief model refers to the use of belief functions as the primary representations of uncertainty. Belief functions1 ...
Table of contents
- Cover
- Half Title
- Title Page
- Copyright Page
- Table of Contents
- List of Figures
- List of Tables
- Preface
- Acknowledgements
- Part I. Introduction to Graphical Belief Models
- Part II. Manipulating Graphical Belief Models
- Part III. Belief Risk Assessment: an Example
- Part IV. Appendixes: Resources for Graphical Modellers
- References
- Index of Subjects
- Index of Citations
Frequently asked questions
Yes, you can cancel anytime from the Subscription tab in your account settings on the Perlego website. Your subscription will stay active until the end of your current billing period. Learn how to cancel your subscription
No, books cannot be downloaded as external files, such as PDFs, for use outside of Perlego. However, you can download books within the Perlego app for offline reading on mobile or tablet. Learn how to download books offline
Perlego offers two plans: Essential and Complete
- Essential is ideal for learners and professionals who enjoy exploring a wide range of subjects. Access the Essential Library with 800,000+ trusted titles and best-sellers across business, personal growth, and the humanities. Includes unlimited reading time and Standard Read Aloud voice.
- Complete: Perfect for advanced learners and researchers needing full, unrestricted access. Unlock 1.4M+ books across hundreds of subjects, including academic and specialized titles. The Complete Plan also includes advanced features like Premium Read Aloud and Research Assistant.
We are an online textbook subscription service, where you can get access to an entire online library for less than the price of a single book per month. With over 1 million books across 990+ topics, we’ve got you covered! Learn about our mission
Look out for the read-aloud symbol on your next book to see if you can listen to it. The read-aloud tool reads text aloud for you, highlighting the text as it is being read. You can pause it, speed it up and slow it down. Learn more about Read Aloud
Yes! You can use the Perlego app on both iOS and Android devices to read anytime, anywhere — even offline. Perfect for commutes or when you’re on the go.
Please note we cannot support devices running on iOS 13 and Android 7 or earlier. Learn more about using the app
Please note we cannot support devices running on iOS 13 and Android 7 or earlier. Learn more about using the app
Yes, you can access Graphical Belief Modeling by Russel .G Almond in PDF and/or ePUB format, as well as other popular books in Mathematics & Probability & Statistics. We have over one million books available in our catalogue for you to explore.