Psychological Statistics: The Basics walks the reader through the core logic of statistical inference and provides a solid grounding in the techniques necessary to understand modern statistical methods in the psychological and behavioral sciences.
This book is designed to be a readable account of the role of statistics in the psychological sciences. Rather than providing a comprehensive reference for statistical methods, Psychological Statistics: The Basics gives the reader an introduction to the core procedures of estimation and model comparison, both of which form the cornerstone of statistical inference in psychology and related fields. Instead of relying on statistical recipes, the book gives the reader the big picture and provides a seamless transition to more advanced methods, including Bayesian model comparison.
Psychological Statistics: The Basics not only serves as an excellent primer for beginners but it is also the perfect refresher for graduate students, early career psychologists, or anyone else interested in seeing the big picture of statistical inference. Concise and conversational, its highly readable tone will engage any reader who wants to learn the basics of psychological statistics.
Trusted by 375,005 students
Access to over 1.5 million titles for a fair monthly price.
Chapter 1A (very) brief introduction to statistical inference
DOI: 10.4324/9781003181828-1
Many books on psychological statistics begin with a discussion about why statistics is important. Like those books, we will also begin with such a discussion.
But this is one of the only ways in which this book is like the other statistics books. I'll say more about this later.
So, why will you – the reader – benefit from learning statistics? Why is statistics important in the field of psychology?
I am often presented with this question, especially at informal gatherings. It is usually difficult for me to answer the question succinctly. Since I teach statistics and do research to develop new statistical methods, I perceive so much beauty in the theory and practice of statistics that I want the listener to perceive it in an equally vivid fashion. Ultimately, the limitation of time intervenes and I am left resorting to some wholly unremarkable answer such as “Well, in psychology we are often interested in treatments and interventions, and we use statistics to find out if they worked”.
This answer usually makes me cringe as soon as it leaves my lips. Yes, it is true, but it is very shallow. There is so much more to psychological statistics. Look at the size of any contemporary textbook for statistics in the behavioral sciences. They're huge. In fact, these textbooks are often so big that they become difficult to read. What they achieve in comprehension becomes a barrier to the beginner who wants a concise introduction to the subject. That is exactly my aim in writing this book.
Let's talk about the basics of psychological statistics.
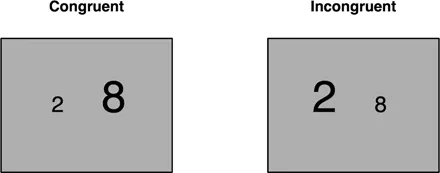
I am a behavioral scientist, so most of the descriptions I will give throughout the book will be born from the context of doing research. But everything I will describe is equally applicable to psychologists as practitioners too; I'm just not as familiar with that world. As a researcher, I study numerical cognition, so I am interested in understanding how people think about numbers. This is a big aim, so let's scale it back a bit. One very specific phenomenon that interests me is something called the size congruity effect (Henik & Tzelgov, 1982), which I can easily describe. In laboratory experiments, researchers in numerical cognition often ask people to quickly choose the larger among pairs of numbers presented on a computer screen. For example, we might ask people to choose the number with the larger physical size – two examples are presented in Figure 1.1.
Figure1.1Two types of trials in a number size comparison task.
It probably seems like an easy task, right? All you need to do is look for the physically larger number and indicate it with a button press – for example, press the left arrow key if the larger is the number on the left, and press the right arrow key if the larger is the number on the right. Indeed, it is an easy task, as people usually complete each of these comparison trials in less than a second. But there is something subtle about how we perceive numbers lying just below the surface. Let's dig deeper.
In these experiments, we purposely present people with two different types of trials. In one condition (see the screen labeled “Congruent” in Figure 1.1), the physically larger number is also the numerically larger number. We call these trials congruent because the relationship implied by physical magnitudes is aligned with that implied by the numerical magnitudes. But in the other condition, you'll notice that the physically larger number is the numerically smaller number. These trials are called “incongruent”. Perhaps surprisingly, people are ever so slightly slower on these incongruent trials (usually about 50–60 milliseconds). That is, even though the task only requires us to pay attention to the physical size of the numbers, the numerical magnitude of the numbers seems to interfere with this decision. Surely we could just ignore the numerical magnitude and focus our attention solely on the physical size of the digits?
It turns out that the answer is “no”. People are slower on the incongruent trials; that is, they exhibit a “size congruity effect”. But how can I justify this claim?
Well, that is the point of this book. We will use the tools of statistical inferencethe process of using parameter estimation and model comparison to justify population-level claims about observable phenomena using observed sample data. to provide justification of this claim. To motivate your reading of the rest of the book, let's walk through a “30,000-foot view” of the process of statistical inference.
When I ask a specific question about human behavior (e.g., are people slower on incongruent trials?), I am ultimately engaging in a very hard exercise. I am trying to answer something about a lot of people (ultimately, the entire human populationin the context of a research question, this is the set of all observable units (e.g., people) to which I want to generalize an observable phenomenon.), but I cannot possibly test every single person. Thus, I must resort to testing a relatively small subset, or samplea subset of a population that is actually observed/measured., of this population and then using those data to infer something about the larger population.
To do this, I set up an experiment and collect data in order to test competing modelsa quantitative instantiation of some observable phenomenon. In this book, models are usually statistical models, so they are specified in terms of restricting the values of parameters in some probability distribution. of that specified human behavior. Here, I use the term “model” to refer to any quantitative instantiation of some behavior. These statistical models are a bit different from the types of models you may have previously encountered during your study of the psychological sciences, such as the multistore (i.e., modal) model of memory of Atkinson and Shiffrin (1968) or the Big Five model of personality (Goldberg, 1993). Whereas these models are used to qualitatively understand the structure of some psychological construct (e.g., memory and personality, respectively), a statistical model is purely a quantitative abstraction. In a sense, a model is our best guess about what is going on at the population level.
For example, let us define the size congruity effect as the difference in average response times between the two types of trials – that is, the average response time for the incongruent trials minus the average response time for the congruent trials. Now, let us consider two potential models for this behavior:
Model 1: the size congruity effect is equal to 0, and
Model 2: the size congruity effect is greater than 0.
Let's discuss what these models meanalso known as the average, it is a measure of center that is defined as the sum of the measurements divided by the number of measurements.. Model 1 says that the size congruity effect is equal to 0, which means that there is no difference between the average response times for congruent and incongruent trials. On the other hand, Model 2 says that the size congruity effect is greater than 0, which means that the average response time for incongruent trials is larger than the average response time for congruent trials. Clearly, these two models make very different predictions about human behavior. Model 1 says that, on average, congruent trials and incongruent trials take the same amount of time to complete. If Model 1 holds, then it would imply that numerical magnitude and physical magnitude are separate things, and that there is no interference between them. On the other hand, Model 2 says that, on average, incongruent trials are slower than congruent trials. If Model 2 holds, then it would imply that numerical magnitude interferes with the physical size judgment, which would mean that the two different types of magnitude are inextricably linked.
So which model is the “right” one?
You'll likely notice that at no point in this discussion have we talked about any actually observed data. Instead, we have proposed these two models a priori; that is, before observing any data. The models are theoretical. This is how science works – we propose competing explanations (models) and then verify these explanations against observed data. We have our models, so let's collect some data – and this is where statistical inference comes in. Once we have the observed data, we engage in model comparisonthe process of assessing which model is most likely to predict some observed data. Whereas hypothesis testing is traditionally done in the context of two models, model comparison can involve considering any number of candidate models against a set of observed data., which amounts to a single question: which model best predicts our observed data?
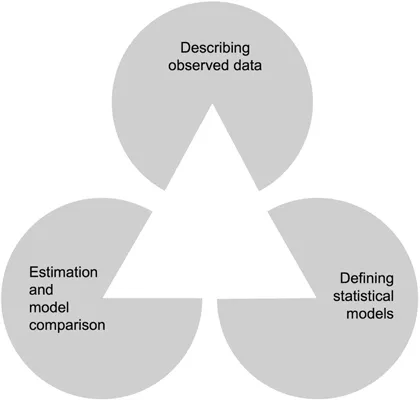
Almost everything we do with statistics in the psychological and behavioral sciences comes down to three things: describing data, setting up models, and figuring out which of those models best explains the data we've observed. This is illustrated nicely in Figure 1.2.
Figure1.2A framework for psychological statistics based on the Kanizsa (1976) triangle illusion.
Figure 1.2 is an example of the Kanizsa (1976) triangle illusion, and it serves as an excellent framework for understanding how psychological statistics works. The three components I just mentioned serve as the three anchors of the figure. Importantly, if you look at the figure just right, you may perceive a triangle that pops out of the middle between the three Pac-Man-shaped anchors. It is important to note that the triangle is not physically there – rather, it is an inferred object that we perceive. This “illusory triangle” serves as a strong metaphor for our scientific quest of things that are impossible to see. From the three concrete anchors of describing our data, defining models, and comparing the models, we are able to see the answers we seek in our pursuit of knowledge of how the mind works.
From this vantage point, I can offer a simple answer to the question of “why statistics?”: it is the tool that allows us to see the unseeable in our scientific pursuits.
Chapter previews
To conclude this short introductory chapter, I will walk you through how we will engage these anchors so that scientific truth will “pop out”. But before that, I want to convince you that even though my example is very specific to numerical cognition and seems to live solely in the world of theoretical research, the idea of model comparison is central to all aspects of the psychological sciences. As I mentioned earlier, practitioners of psychology might be interested in understanding how to test whether some treatment works. After all, if the treatment doesn't work, why administer it? In this context, we can do something similar to what we did above. For example, before administering the treatment, we can set up two a priori models: one where the treatment works (i.e., people who undergo the treatment score higher – or lower – on some outcome than people in a control group), and one where the treatment do...
Table of contents
Cover Page
Endorsement Page
Half-Title Page
Series Page
Title Page
Copyright Page
Contents
Preface
1 A (very) brief introduction to statistical inference
2 Describing the observed data
3 Modeling the observed data
4 How likely is the observed data?
5 Comparing statistical models
6 Introduction to the t-test
7 Bayesian model comparison
8 Recap and next steps
Glossary
Answers to end-of-chapter exercises
References
Index
Frequently asked questions
Yes, you can cancel anytime from the Subscription tab in your account settings on the Perlego website. Your subscription will stay active until the end of your current billing period. Learn how to cancel your subscription
No, books cannot be downloaded as external files, such as PDFs, for use outside of Perlego. However, you can download books within the Perlego app for offline reading on mobile or tablet. Learn how to download books offline
Perlego offers two plans: Essential and Complete
Essential is ideal for learners and professionals who enjoy exploring a wide range of subjects. Access the Essential Library with 800,000+ trusted titles and best-sellers across business, personal growth, and the humanities. Includes unlimited reading time and Standard Read Aloud voice.
Complete: Perfect for advanced learners and researchers needing full, unrestricted access. Unlock 1.5M+ books across hundreds of subjects, including academic and specialized titles. The Complete Plan also includes advanced features like Premium Read Aloud and Research Assistant.
Both plans are available with monthly, semester, or annual billing cycles.
We are an online textbook subscription service, where you can get access to an entire online library for less than the price of a single book per month. With over 1.5 million books across 990+ topics, we’ve got you covered! Learn about our mission
Look out for the read-aloud symbol on your next book to see if you can listen to it. The read-aloud tool reads text aloud for you, highlighting the text as it is being read. You can pause it, speed it up and slow it down. Learn more about Read Aloud
Yes! You can use the Perlego app on both iOS and Android devices to read anytime, anywhere — even offline. Perfect for commutes or when you’re on the go. Please note we cannot support devices running on iOS 13 and Android 7 or earlier. Learn more about using the app
Yes, you can access Psychological Statistics by Thomas J. Faulkenberry in PDF and/or ePUB format, as well as other popular books in Psychology & History & Theory in Psychology. We have over 1.5 million books available in our catalogue for you to explore.