Data Analytics for Business
eBook - ePub

Data Analytics for Business

Foundations and Industry Applications

Fenio Annansingh, Joseph Bon Sesay

Share book
  1. 276 pages
  2. English
  3. ePUB (mobile friendly)
  4. Available on iOS & Android
eBook - ePub

Data Analytics for Business

Foundations and Industry Applications

Fenio Annansingh, Joseph Bon Sesay

Book details
Book preview
Table of contents
Citations

About This Book

Data analytics underpin our modern data-driven economy. This textbook explains the relevance of data analytics at the firm and industry levels, tracing the evolution and key components of the field, and showing how data analytics insights can be leveraged for business results.

The first section of the text covers key topics such as data analytics tools, data mining, business intelligence, customer relationship management, and cybersecurity. The chapters then take anindustry focus, exploring how data analytics can be used in particular settings to strengthen business decision-making. A range of sectorsare examined, including financial services, accounting, marketing, sport, health care, retail, transport, and education. With industry case studies, clear definitions of terminology, and no background knowledge required, this text supports students in gaining a solid understanding of data analytics and its practical applications. PowerPoint slides, a test bank of questions, and an instructor's manual are also provided as online supplements.

This will be a valuable text for undergraduate level courses in data analytics, data mining, business intelligence, and related areas.

Frequently asked questions

How do I cancel my subscription?
Simply head over to the account section in settings and click on “Cancel Subscription” - it’s as simple as that. After you cancel, your membership will stay active for the remainder of the time you’ve paid for. Learn more here.
Can/how do I download books?
At the moment all of our mobile-responsive ePub books are available to download via the app. Most of our PDFs are also available to download and we're working on making the final remaining ones downloadable now. Learn more here.
What is the difference between the pricing plans?
Both plans give you full access to the library and all of Perlego’s features. The only differences are the price and subscription period: With the annual plan you’ll save around 30% compared to 12 months on the monthly plan.
What is Perlego?
We are an online textbook subscription service, where you can get access to an entire online library for less than the price of a single book per month. With over 1 million books across 1000+ topics, we’ve got you covered! Learn more here.
Do you support text-to-speech?
Look out for the read-aloud symbol on your next book to see if you can listen to it. The read-aloud tool reads text aloud for you, highlighting the text as it is being read. You can pause it, speed it up and slow it down. Learn more here.
Is Data Analytics for Business an online PDF/ePUB?
Yes, you can access Data Analytics for Business by Fenio Annansingh, Joseph Bon Sesay in PDF and/or ePUB format, as well as other popular books in Business & Business General. We have over one million books available in our catalogue for you to explore.

Information

Publisher
Routledge
Year
2022
ISBN
9781000577907
Edition
1

1 History and Evolution of Data Analytics

DOI: 10.4324/9781003129356-1
Data analytics is statistically based. However, traditionally this was limited to the kinds of data available and solutions accessible to process it. This chapter introduces data analytics, history, and its development. Consequently, the types of roles for people working with data became highly specialised. However, the catalysts for change in this area started in the late 1960s, with the increased use of computers for decision support. As a result, data analytics has evolved significantly, as data is everywhere and exists in many forms. Since business, analytics, and technology have improved exponentially and will likely continue in this trajectory, it is crucial to track the development and growth of technology and just how meaningful it has been for business growth over time.

LEARNING OBJECTIVES:

At the end of this chapter, you should be able to:
  • Understand the history and evolution of data analytics
  • Identify the difference between data, information, knowledge, intelligence, and wisdom
  • Define the different types of knowledge
  • Identify the different categories of data
  • Explain data science and its components
  • Discuss the phases of data science

History and Evolution of Data Analytics

Data analytics emerged as a separate discipline from statistics in the 1950s with analytics 1.0. Associated with this period are the developing tools capable of capturing data and identifying patterns and trends faster than the human mind. Internal data sources were small and structured. Consequently, batch-processing operations took months and few detailed reports. The focus then was on data collection and preparation rather than data analysis. At this time, most companies started experiencing a steady increase in their data volumes, leading to the growth in demand for software that could assist with data analysis.
In the mid-2000s, analytics 2.0 appeared, which created a difference in quality and quantity of data. The increasing popularity of social networking sites like Facebook and Google initiated discovering, collecting, and analysing new information. Companies’ internal operations generated data from various sources such as the Internet, projects, and public data. The advancement and consideration of data quality led to the change to analytics 2.0. With analytics 2.0 came the increased ability of companies to analyse the data and gain greater insight into business processes and increase profit margins. This era saw the development of novel processing structures that include the use of software for productivity tracking such as No-SQL and Hadoop.
The third period of data analytics was from 2010, which led to the creation of analytics 3.0. Here, customers received a personalised user experience. The advent of new disciplines such as prescriptive and predictive analytics complements using descriptive-analytical, which existed in analytics 2.0. The evolution of business analytics continued as enterprises grew and became more resourceful, using the information to make competitive decisions.
Traditionally, data generation and usage were paper-based. However, the recent advances in technology relating to how data is processed, stored, and transmitted and advances in intelligent computer software, reducing costs and increasing capacity, have resulted in companies moving from paper to technologically driven data. With the growth and acceptance of the Internet of Things, larger quantities of data are generated and consumed. The increased connectivity among machines and data from financial transactions and sensors such as security cameras allows businesses to gather data from very diverse and widespread sources. These data provide a rich source of information transformed into new, valuable, valid, and human-understandable knowledge. Therefore, there is a growing interest in exploring data to extract knowledge and business intelligence used to support decision-making in a wide variety of fields: cybersecurity, accounting, education, environment, finance, government, industry, medicine, transport, and social care.

Data

Data is everywhere. It is considered the new oil and is fundamental to business decisions. Data is raw or unprocessed facts. It lacks meaning and is generally unorganised. Data exists and has no significance beyond its existence (in and of itself). It can exist in any form, usable or not. It has no meaning in itself. Some examples of data include a sequence of bits, numbers, characters on a page, and sound recordings. The ability to gather the correct data, analyse, interpret, and act accordingly is crucial for the company’s success. But the quantity of data accessible to companies is ever increasing, as are the different types of data available.
Information results from processing or analysing data into meaningful conclusions that can be used in various ways. The process of mining information from raw data is called data analysis. The purpose of data analysis is to extract information (Table 1.1).

When Does Data Become Information?

Data

Table 1.1 Provides Examples of Data
Example Looking at the examples given for data:
  • 4,8,12,16, and 20
  • lion, tiger, elephant, snakes, monkey
  • 161.2, 175.3, 166.4, 164.7, 169.3

Information

Information is data that has been cleaned of errors, analysed, and processed to give meaning. Once processed, it becomes easier to measure, visualise, and explore for a specific purpose. By asking relevant questions about “who,” “what,” “when,” “where,” and “how,” companies can derive valuable information from the data, thus making it more useful. The purpose of processing data and transforming it into information is to help organisations make better and more informed decisions leading to successful outcomes and competitive advantage. The tool used for collecting and processing data for organisations is Information Systems (IS), a combination of technologies, procedures, and tools that assemble and distribute information needed to make decisions.
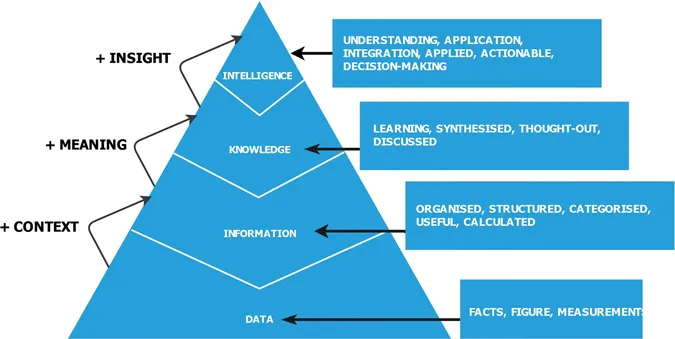
The diagram below shows the relationship between data, information, knowledge, and wisdom (Figure 1.1).
A diagram represents a step by step relationship where a data is processed as information, acquired as knowledge leading to intelligence.
Figure 1.1 Relationship Between Data, Information, Knowledge, and Wisdom.
Long Description for Figure 1.1
Data and information form part of the context. Data in the form of facts, figure, and measurement is converted into useful data which is organised, structured, categorised, and calculated leading to information. The learning from the information is synthesised, thought out, and discussed leading to knowledge. Information and knowledge add meaning to the context. The acquired knowledge leads to intelligence that enables understanding, application integration, applied, actionable, and decision making. Knowledge and intelligence add insight into the data.

Knowledge

Knowledge resides or is contained within the brain and is generally a result of one’s experience applied to the organisation. Knowledge is closely connected to doing and implies the capacity to act (know-how), cognition or recognition (know-what), and understanding (know-why). There are different types of knowledge: tacit, implicit, and explicit.
  • Explicit Knowledge is the knowledge that is formalised and codified and is sometimes referred to as know-what. Explicit knowledge is relatively easy to identify, store, and retrieve. It is similar to information and involves management ensuring that employees have access to what they need. Explicit knowledge in the organisation should be stored, reviewed, updated, or destroyed.
  • Tacit Knowledge is difficult to pass from one person to another. It is knowing how to do something. Tacit knowledge is intuitive, which is hard to define and is mainly experience-based. It is also considered the most valuable source of knowledge and the most likely to lead to innovation and creativity. Tacit knowledge is used to provide companies with a competitive advantage when applied to business goals. It is also used to create or increase value for the company.
  • Implicit Knowledge is unconscious knowledge that is it lies outside of the individual’s awareness. Implicit knowledge is difficult to verbalise and can only be inferred from behaviour. It is difficult to transfer. It emerges from task performance. Once the employee knows and understands the explicit knowledge as indicated by a manual or supervisor, it leads to more profound knowledge. An individual who implicitly understands the reason behind a specific set of instructions will better appreciate why a particular course of action occurs. This allows for collaboration and leads to new and improved ways for companies to operate.

Relationship Between Data, Information, and Knowledge

Based on the definitions of data, information, and knowledge, the relationships between data and information, information, and knowledge, are intertwined and consequently, they are often regarded as interchangeable. However, they are distinct entities (Table 1.2).
If we put Knowledge into an equation, it would look like this: Information + application or use = Knowledge
Transforming Data to Information
Data + Meaning = Information
Table 1.2 Provides an Outline of the Intricate Relationship between Data, Information and Knowledge
Example 1 of data: Looking at the examples given for data:
  • 4,8,12,16, and 20
  • lion, tiger, elephant, snakes, monkey
  • 161.2, 175.3, 166.4, 164.7, 169.3
Only when assigned a context or meaning, does the data become information. It all becomes meaningful when we are told:
  • 4,8,12,16, and 20 are the first five answers in the 4x table
  • lion, tiger, elephant, snakes, and monkey is a list of zoo animals
  • 161.2, 175.3, 166.4, 164.7, 169.3 are the heights of a 15-year-old student

Intelligence

Intelligence is the ability to sense the environment, make decisions, and control action. An individual or system can transform information into behaviours. Higher levels of intelligence can include the ability to recognise objects and events, present knowledge in a world model, and reason about future strategic directions. Advanced forms of intelligence provide the capacity to perceive and understand, choose wisely, and act successfully under a wide range of circumstances.
Paradigms of intelligence include natural intelligence, artificial intelligence, machine intelligence, and computational intelligence. In addition, the development of cognitive robots, cognitive computers, intelligent systems, and software agents indicates that intelligence may also be created or implemented by machines and manufactured systems.

Categories of Data

Data can be divided into two main categories: structured or unstructured data.

Structured Data

Structured data refers to data that exists in a fixed field within a file or record. It is data that adheres to a predefined data model and is, therefore, easier to analyse. Structured data follows a tabular format with relationships between the different rows and columns. Each of these has structured rows and columns that can be sorted. It depends on creating a data model, defining what types of data to include, storing, processing, and accessing it. In a data model, each field is discrete and can be accessed separately or jointly with other areas. This makes structured data exceptionally powerful. It is possible to aggregate data from various locations in the database quickly. It is considered the most traditional form of data storage. The programming language employed for structured data is SQL (Structured Query Language). Classic examples of structured data include names, addresses, credit card numbers, and geolocation.

Unstructured Data

Unstructured data is data that is not structured in a predefined way. It is typically text-based but may contain dates, numbers, and facts as well. There is no data model as the data is stored in its native format. Typical examples of unstructured data include rich media, text, social media activity, surveillance imagery, audio, video files, or No-SQL databases. The capability to store and produce unstructured data has increased significantly in recent years, with many new technologies and tools available to store specialised unstructured data types. Th...

Table of contents