- English
- ePUB (mobile friendly)
- Available on iOS & Android
Excel Dashboards & Reports For Dummies
About this book
It's time for some truly "Excel-lent" spreadsheet reporting
Beneath the seemingly endless rows and columns of cells, the latest version of Microsoft Excel boasts an astonishing variety of features and capabilities. But how do you go about tapping into some of that power without spending all of your days becoming a spreadsheet guru?
It's easy. You grab a copy of the newest edition of Excel Dashboards & Reports For Dummies and get ready to blow the pants off your next presentation audience!
With this book, you'll learn how to transform those rows and columns of data into dynamic reports, dashboards, and visualizations. You'll draw powerful new insights from your company's numbers to share with your colleagues – and seem like the smartest person in the room while you're doing it.
Excel Dashboards & Reports For Dummies offers:
- Complete coverage of the latest version of Microsoft Excel provided in the Microsoft 365 subscription
- Strategies to automate your reporting so you don't have to manually crunch the numbers every week, month, quarter, or year
- Ways to get new perspectives on old data, visualizing it so you can find solutions no one else has seen before
If you're ready to make your company's numbers and spreadsheets dance, it's time to get the book that'll have them moving to your tune in no time. Get Excel Dashboards & Reports For Dummies today.
Tools to learn more effectively

Saving Books

Keyword Search

Annotating Text

Listen to it instead
Information
Getting Started with Excel Dashboards and Reports
Getting in the Dashboard State of Mind


Defining Dashboards and Reports
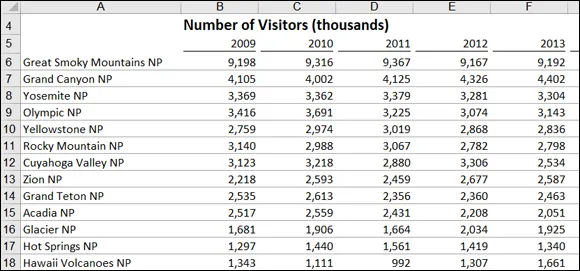
Defining reports

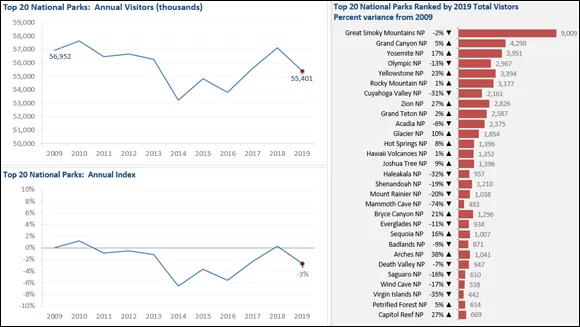
Defining dashboards
- Dashboards are typically graphical in nature, providing visualizations that help focus attention on key trends, comparisons, and exceptions.
- Dashboards often display only data that are relevant to the goal of the dashboard.
- Because dashboards are designed with a specific purpose or goal, they inherently contain predefined conclusions that relieve the end user from performing his own analysis.

Table of contents
- Cover
- Title Page
- Table of Contents
- Introduction
- Part 1: Getting Started with Excel Dashboards and Reports
- Part 2: Building Basic Dashboard Components
- Part 3: Adding Charts to Your Dashboards
- Part 4: Advanced Reporting Techniques
- Part 5: The Part of Tens
- Index
- About the Author
- Advertisement Page
- Connect with Dummies
- End User License Agreement
Frequently asked questions
- Essential is ideal for learners and professionals who enjoy exploring a wide range of subjects. Access the Essential Library with 800,000+ trusted titles and best-sellers across business, personal growth, and the humanities. Includes unlimited reading time and Standard Read Aloud voice.
- Complete: Perfect for advanced learners and researchers needing full, unrestricted access. Unlock 1.4M+ books across hundreds of subjects, including academic and specialized titles. The Complete Plan also includes advanced features like Premium Read Aloud and Research Assistant.
Please note we cannot support devices running on iOS 13 and Android 7 or earlier. Learn more about using the app