Why is the South African stock market important? First, it is classified as an emerging market. However, while the country shows emerging characteristics, its stock market is highly developed. It is one of the oldest stock exchanges in the world and is the eighteenth largest in the world in terms of market capitalisation and trade. It is by far the largest of Africa's 29 exchanges and accounts for over a third of the stocks listed on the continent. It is an integral part of the world-class financial infrastructure of the country, and South Africa was ranked first of 139 countries for its regulation of securities exchanges by the World Economic Forum in 2010. Global emerging markets are evolving into developed markets, while frontier markets are becoming the new emerging markets. Understanding the South African market provides insight into the paths that these markets will follow in future. Similarly, the techniques highlighted in the book for dealing with volatility are applicable to similar markets elsewhere. Second, South Africa is the newest member of the BRICS grouping. This gives it the role of Africa's representative and it is of particular interest to China as a bridgehead to access this resource-rich continent. Third, it is a gateway into Africa, both directly in terms of its highly developed financial, legal and banking infrastructure and indirectly, through the exposure of many of its top corporates to African countries. Finally, it is an attractive market in its own right. It has been the third-best performing stock market in the world since 1900, and has weathered the great financial crisis with flying colours. While the investment lessons from the South African market outlined in this book are universal, understanding some of its peculiarities is also important. For example, some insight into the behaviour of the currency, the rand, is clearly critical in terms of any investment in this market, as well as in providing some understanding of other volatile emerging market currencies, and also because it is often treated as the most liquid proxy for these currencies, particularly during upheavals. In addition, traditional macroeconomic approaches to investment in this market often don't work because of the weak correspondence between the compositions of the economy and the market and the dominance of resources, a fact which is usually missed by analysts in developed countries. Unlike the promises in many populist investment books, this book won't make you immensely wealthy quickly. It may not even make you immensely wealthy slowly. What it will do is explain the most important features of how the stock market works; guide you into forming realistic expectations; help you to avoid the most common pitfalls and evaluate investment information critically and show you how to reduce risk and enhance returns. It should save you money and time and I hope it provides new and practical insights, regardless of your investment experience.
- 512 pages
- English
- ePUB (mobile friendly)
- Available on iOS & Android
eBook - ePub
Effective Investor
About this book
Trusted by 375,005 students
Access to over 1.5 million titles for a fair monthly price.
Study more efficiently using our study tools.
PART ONE
THE FUNDAMENTALS
In the first part of this book we address the fundamentals of investment and the way things are supposed to work in theory – what the returns we seek consist of, the factors that influence these returns, the behaviour of these factors and their relative importance, how to value shares and the actual investment record of various assets.
In Chapter 1 we define returns and their components, and discover that over the long term company earnings are all-important. We therefore look at how earnings behave and ways of estimating them.
Chapter 2 examines the other elements that influence share prices, their relative importance, particularly expectations, and how to gauge them. Individual investors may wish to skim over some of the detail while extracting the key conclusions that are highlighted.
Chapter 3 explains what we mean by the “market” and highlights an important principle of how to beat it over the long term. It also discusses the relationship between shares and bonds and how to gauge their relative attractiveness.
How does one value shares? This is the topic of Chapter 4 and, after discussing how efficient the market is, we look at basic valuation methods and some of their hazards.
Chapter 5 is possibly the most useful in the book, showing the actual rewards, risk and behaviour of various assets in South Africa going back 109 years. The lessons here are implicit. This chapter will also be particularly helpful for advisors in dealing with their clients.
Chapter 6 emphasises the importance of time in investment.
These six chapters provide an essential grounding for all investors.
1
WHAT DRIVES RETURNS

An investment operation is one which upon thorough analysis promises safety of principal and an adequate return. Operations not meeting these requirements are speculative.
Benjamin Graham
This book is about investing, not trading. Trading, because of its short-term nature, is intrinsically speculative according to Graham’s definition.
So what is investing? Investing is spending money now to receive more money back in the future. We also want it to be more money in real terms, i.e. after inflation. Normally we spend our money on assets. These could be equities (shares), bonds, fancy financial instruments, property or gold coins; we could also lend our money, for example, to a bank. (Equities is another word for shares – we will use the terms equities, shares and stocks interchangeably.) While we will touch on most of these asset classes, our focus will predominantly be on equities.
The principles in this chapter will usually be illustrated for the overall equity market, but these concepts are also applicable to individual shares.
TOTAL RETURNS
The money received from equities comes from price appreciation and dividends.
Companies distribute a portion of their earnings to shareholders in the form of dividends. In the words of Graham and Dodd, “The primary purpose of a business corporation is to pay dividends to its owners.” Dividends are normally expressed as cents per each share that has been issued. For example, if a company produces dividends of R9m and it has 3m shares in issue, its dividends are R3 or 300c per share. This is convenient because the price of a share is usually expressed in cents as well.
The dividend yield (DY) is calculated by dividing these cents per share by the share price, also in cents, and expressing the result as a percentage. This is analogous to an interest rate. For example, if you receive this annual dividend of 300c on a share and its share price is 10 000c, its dividend yield is 3%.
The total return from a share, expressed as a percentage, is the change in price (the capital gain or price return, also expressed as a percentage) plus dividend yield (the income return).
Total return = change in price + dividend yield
For example, say you buy a share at 10 000c. It then appreciates to 12 000c and the company pays a dividend of 300c. The capital gain is 20%, the dividend yield is 300c/10 000c × 100 = 3% and the total return is therefore 23%.
COMPONENTS OF RETURN
We can now break up the price return into two components – change in earnings and change in rating. Let’s first define these components.
Earnings are essentially the taxed profits that companies produce. They are also expressed as cents per each share that has been issued. For example, if a company produces taxed profits of R21m and it has 3m shares in issue, its earnings are R7 or 700c per share. For the overall stock market, earnings are the sum of all the listed companies’ earnings divided by the total number of shares in issue.
A share’s rating is a measure of how its earnings are valued, i.e. what price is attributed to its earnings. For example, two shares may each have earnings of 700c per share. However, one may be priced at 7 000c, i.e. the share is valued at a price which is 10 times its current earnings, while the other may be priced at 10 500c or 15 times its current earnings. Differences in ratings are caused by different expectations of future earnings growth, risk, the volatility of future earnings, inflation (and hence the valueless component of earnings), interest rates which, together with inflation, determine the real discount rate, as well as general sentiment and behavioural effects. We will discuss many of these aspects later.
Rating is usually expressed as the PE ratio, which is simply the price (per share) P divided by the earnings (per share) E. Although dividend yield and earnings yield (earnings divided by price or the reciprocal of PE) also indicate how a share is rated, when we speak of rating this will normally refer to PE.
We can now break up the price return as follows:
Price return = change in PE + change in earnings
So our previous formula for total return now has three components:
Total return = change in PE + change in earnings + dividend yield
These are the only three factors that determine returns*.
The relative importance of these three components of return changes, depending on the duration of the investment. The graph in Figure 1.1 shows their relative contribution to the returns from the overall stock market over different periods. The round markers represent annualised average returns over these periods.
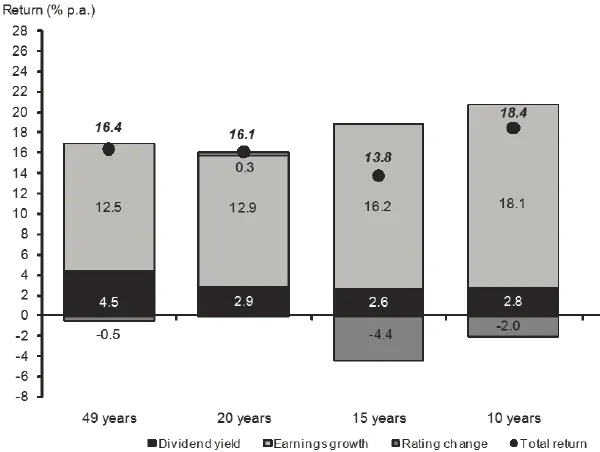
Figure 1.1 Contributions to the ALSI’s compounded total return (1960 – 2008)
First, note the stability of the contribution from dividend yield. This averaged 3.1% p.a. over the periods shown. While this appears to be low, do not ignore dividends.
The power of dividends lies in the compounding of their reinvestment back into a share or the market.
Second, while the contribution of rating changes has been large over the last five years, it has been small over longer periods, averaging just –2.6% p.a. over all periods. Over the last 49 years the contribution of rating changes to returns has been negligible at – 0.5%, emphasising that over the long term returns tend to follow earnings only. If earnings growth is relatively stable over the long term, the corollary therefore is that returns should also be stable. This is borne out well by the data, with average annual returns over the past 10, 15, 20 and 49 years all lying between 13.8% p.a. and 18.4% p.a. Another effect is that the range of returns over longer periods diminishes. We will discuss this so-called time diversification of risk in Chapter 14.
The graph in Figure 1.2 shows the contribution of the three components to rolling 20-year returns. Since the data begins in 1960, the first points on this graph start in 1980....
Table of contents
- Cover
- Title
- Copyright
- Dedication
- Table of Contents
- The Eleven Great Investment Pictures
- Acknowledgements
- Foreword
- Introduction
- Part 1: The Fundamentals
- Part 2: The Implementation
- Part 3: The Psychology
- Part 4: Styles And Techniques
- Part 5: Looking After Yourself
- Appendix: Long-term asset class returns
- Bibliography: The best investment books
- Investment resources
- Index
Frequently asked questions
Yes, you can cancel anytime from the Subscription tab in your account settings on the Perlego website. Your subscription will stay active until the end of your current billing period. Learn how to cancel your subscription
No, books cannot be downloaded as external files, such as PDFs, for use outside of Perlego. However, you can download books within the Perlego app for offline reading on mobile or tablet. Learn how to download books offline
Perlego offers two plans: Essential and Complete
- Essential is ideal for learners and professionals who enjoy exploring a wide range of subjects. Access the Essential Library with 800,000+ trusted titles and best-sellers across business, personal growth, and the humanities. Includes unlimited reading time and Standard Read Aloud voice.
- Complete: Perfect for advanced learners and researchers needing full, unrestricted access. Unlock 1.5M+ books across hundreds of subjects, including academic and specialized titles. The Complete Plan also includes advanced features like Premium Read Aloud and Research Assistant.
We are an online textbook subscription service, where you can get access to an entire online library for less than the price of a single book per month. With over 1.5 million books across 990+ topics, we’ve got you covered! Learn about our mission
Look out for the read-aloud symbol on your next book to see if you can listen to it. The read-aloud tool reads text aloud for you, highlighting the text as it is being read. You can pause it, speed it up and slow it down. Learn more about Read Aloud
Yes! You can use the Perlego app on both iOS and Android devices to read anytime, anywhere — even offline. Perfect for commutes or when you’re on the go.
Please note we cannot support devices running on iOS 13 and Android 7 or earlier. Learn more about using the app
Please note we cannot support devices running on iOS 13 and Android 7 or earlier. Learn more about using the app
Yes, you can access Effective Investor by Franco Busetti in PDF and/or ePUB format, as well as other popular books in Economics & Investments & Securities. We have over 1.5 million books available in our catalogue for you to explore.