In this provocative study, Michael Soto examines African American cultural forms through the lens of census history to tell the story of how U.S. officialdom—in particular the Census Bureau—placed persons of African descent within a shifting taxonomy of racial difference, and how African American writers and intellectuals described a far more complex situation of interracial social contact and intra-racial diversity. What we now call African American identity and the literature that gives it voice emerged out of social, cultural, and intellectual forces that fused in Harlem roughly one century ago.
Measuring the Harlem Renaissance sifts through a wide range of authors and ideas—from W. E. B. Du Bois, Rudolph Fisher, and Nella Larsen to Zora Neale Hurston, Langston Hughes, and Wallace Thurman, and from census history to the Great Migration—to provide a fresh take on late nineteenth—and twentieth—century literature and social thought. Soto reveals how Harlem came to be known as the "cultural capital of black America," and how these ideas left us with unforgettable fiction and poetry.
eBook - ePub
Measuring the Harlem Renaissance
The U.S. Census, African American Identity, and Literary Form
- English
- ePUB (mobile friendly)
- Available on iOS & Android
eBook - ePub
Measuring the Harlem Renaissance
The U.S. Census, African American Identity, and Literary Form
About this book
Trusted by 375,005 students
Access to over 1.5 million titles for a fair monthly price.
Study more efficiently using our study tools.
Information
Publisher
University of Massachusetts PressYear
2018Print ISBN
9781625342508
9781625342492
eBook ISBN
9781613764862
1
Measure for Measure for Measure
Three Eras in American Racial Census Taking
The Great Emancipator and the Geostatistical Imagination (1790–1860)
In the U.S. Capitol building, above the Senate chamber’s west staircase, hangs Francis Bicknell Carpenter’s First Reading of the Emancipation Proclamation by President Lincoln (1864; fig. 1.1). At nine feet tall and fifteen feet wide, the painting depicts a larger-than-life Lincoln surrounded by his war cabinet as the president reads the first draft of the historic document. Carpenter considered emancipation to be “an act unparalleled for moral grandeur in the history of mankind”; Lincoln, according to the painter, declared the Emancipation Proclamation “the central act of [his] administration, and the great event of the nineteenth century.”1 To record the moment, Carpenter spent six months at work in the White House, interviewing his subjects, sketching studies of the persons and things found in the painting, and composing what he hoped to be the pinnacle of his professional career.
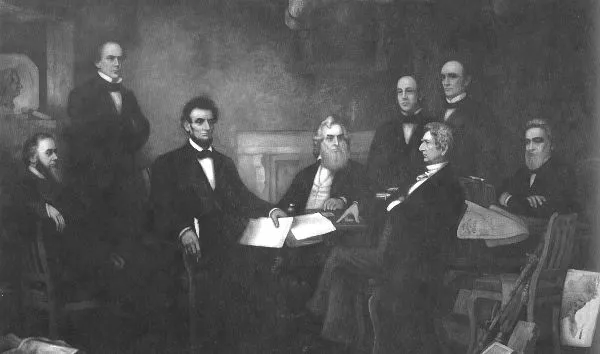
FIGURE 1.1. Francis Bicknell Carpenter, First Reading of the Emancipation Proclamation by President Lincoln, 1864. Courtesy U.S. Senate Collection.
Perhaps ironically, we remember Carpenter more for his memoir, Six Months at the White House with Abraham Lincoln (1866), than for his work as a painter of historical subjects or even as a portrait artist. The memoir, a rare inside look at the Lincoln presidency less than a year before his assassination, offers a hagiographic portrait of the president, one that continues to influence assessments of the man’s moral worth. In Carpenter’s memoir Lincoln emerges as tragically burdened by the demands of history, but not so much that he can’t let out the occasional guffaw; Lincoln is attentive to a diversity of opinion but unwavering in his core convictions and unflappable in the face of political intrigue; he is privately religious and unfailingly kind, even to strangers. Lincoln epitomizes the great moral cause of equality for all.
Carpenter achieves his task by deploying a rhetorical strategy that has its painterly analog, but that is more properly considered linguistic: the literary blazon, the verbal cataloging of a subject’s physical features to reveal his inner moral worth. Lincoln possessed a “gaunt but sinewy” frame in Carpenter’s estimation and was “inclined to stoop when he walked”; his “head was full medium size, with a broad brow, surmounted by rough, unmanageable hair”; and his “complexion was inclined to sallowness”—hardly a flattering portrayal. At the same time, Lincoln’s mouth was “expressive of much firmness and gentleness of character,” and his “eyes were blueish-gray in color,—always in deep shadow, however, from the upper lids, which were unusually heavy, (reminding me, in this respect, of [Gilbert] Stuart’s portrait of Washington,)—and the expression was remarkably pensive and tender, often inexpressibly sad, as if the reservoir of tears lay very near the surface.”2 In this early example of a rendering that merges traditionally feminine and masculine traits, Carpenter insists that Lincoln’s physiognomy replicates his personality, so that tenderness and sadness and firm resolution irrepressibly show themselves on the president’s features. In literature as in heraldry, the blazon testifies to the subject’s purity of bloodline, and in this curious revision of the “blood will out” cliché, Carpenter even suggests, although Washington had no direct descendants, a lineage connecting the nation’s two greatest presidents. What genealogy cannot furnish, art readily supplies.
In the passage immediately preceding this blazon, Carpenter explains the painting’s second most prominent still-life object (after the Emancipation Proclamation draft): a depiction of the “Map Showing the Distribution of the Slave Population of the Southern States” (1861) created by the U.S. Coast Survey.3 Carpenter writes: “Visitors to the Executive Chamber, during the administration of Mr. Lincoln, will remember the lithographic map, showing the slave population of the Southern States in graduated light and shade, which usually leaned against the leg of his desk or table, and bore the marks of much service. The States and counties most abounding in slaves were indicated on this map by degrees of blackness, so that by a glance the proportion of whites and blacks in the different States at the commencement of the Rebellion could be easily comprehended.”4
The map (fig. 1.2) shows a county-by-county, graduated image of slave density in the South in ten-point increments: a white county has a slave population of less than 10 percent, a light gray county has a slave population of 10 to 20 percent, and so on, until the darkest counties indicate a slave population, according to the “Scale of Shade” key, of “80 per ct. & upwards.” Beneath a county’s name is printed the proportion of slaves in its population; Amelia County, Virginia, just west of Richmond, for example, has a slave population of 72.6 percent, resulting in a near-black hue that requires white lettering for the label to be visible. On the bottom center of the map, a table shows the free population, slave population, total population, and percentage of slaves of each southern state. On the bottom left is certification of the map’s accuracy by Joseph C. G. Kennedy, superintendent of the census.
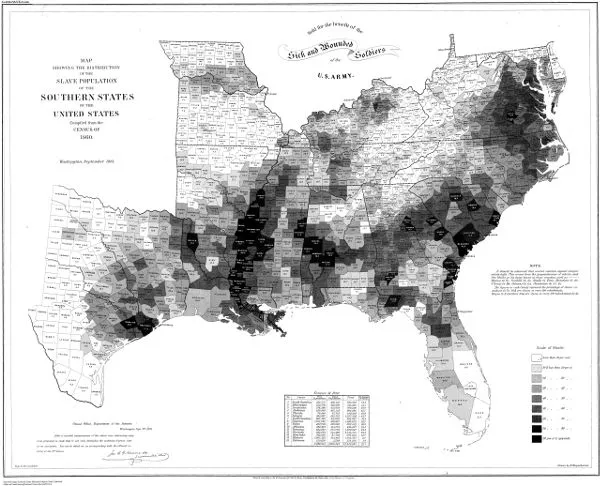
FIGURE 1.2. U.S. Coast Survey, “Map Showing the Distribution of the Slave Population of the Southern States,” 1861. Courtesy Library of Congress, Geography and Map Division.
As he worked on this section of the painting, Carpenter borrowed the map without informing Lincoln, who later discovered it in the painter’s makeshift State Dining Room studio: “One afternoon the President came in alone, as was his wont,—the observation of the daily progress of the picture appearing to afford him a species of recreation. Presently his eye fell upon the map, leaning against a chair, as I had left it after making the study. ‘Ah!’ said he, ‘you have appropriated my map, have you? I have been looking all around for it.’ And with that he put on his spectacles, and, taking it up, walked to the window; and sitting down upon a trunk began to pore over it very earnestly.” According to Carpenter’s anecdote, Lincoln deployed the map as an instrument of wartime intelligence: the Commander in Chief studied its gradations to determine the likelihood that the so-called Kilpatrick-Dahlgren Raid of Union cavalry into Virginia might yield wartime spoils in the form of emancipated slaves. “It is just as I thought it was,” the president inferred, “He is close upon ––– County, where the slaves are the thickest. Now we ought to get a ‘heap’ of them, when [Gen. H. Judson Kilpatrick] returns.”5 (The botched raid badly misfired when Confederate troops killed Colonel Ulric Dahlgren and found on his body documents revealing a scandalous plan to torch Richmond and to assassinate Jefferson Davis.)
The historian Susan Schulten has pointed out that the map’s aesthetic features serve still other purposes: “Its minimalism and absence of decoration and color suggests neutrality and transparency: it appears simply to translate population data into graphic form.” The sheer force of social-scientific truth telling, Schulten adds, masks the map’s ideological underpinnings. The “very decision to map the relationship between slaves and the general population reflects a belief that slavery was behind the rebellion. And . . . the map enabled Lincoln to follow the progress of his military, which after January 1863 had officially become an army of liberation.”6 Seen in this light, the map of southern slavery fits perfectly into Carpenter’s larger project to define Lincoln as a martyr for freedom’s cause, as the Great Emancipator.
We have no reason to doubt that the Coast Survey map allowed Lincoln to unite military strategy with moral imperative, that it symbolized the war’s grand cause of human justice. That the map was so popular in the North—and explicitly “sold for the benefit of the sick and wounded soldiers of the U.S. Army,” according to its heading—reinforces the idea that the twin goals of military victory and abolition were inseparable. The four slave states that remained loyal to the Union, and that were not subject to the Emancipation Proclamation, complicate but do not diminish this understanding of the Coast Survey map.
Even his contemporaneous detractors knew Lincoln to be a shrewd and pragmatic politician, one quick to avail himself as necessary of the hard-knock politics of bureaucratic machinery. The map’s very existence, according to Schulten, stemmed from Lincoln’s desire for compensated emancipation.7 During the first two years of the Civil War, right up to January 1, 1863, when the Emancipation Proclamation, an executive order emancipating southern slaves “upon military necessity,” took effect, Lincoln pressed for gradual, compensated emancipation, a gesture meant to retain the loyalty of the four border states and to encourage the peaceful return of Confederate states to the Union.8 Such an approach would require geographic precision because Lincoln, a conservative Constitutionalist, believed that each state must arrive individually at a negotiated settlement to free its slaves.
The map very likely allowed Lincoln to see quickly the regional economics of such compensation, which would surely require a large overall price tag. As the historian Eric Foner notes, slaves at the start of the Civil War, when considered only for their monetary value, “exceeded the combined worth of all the banks, railroads, and factories in the United States”; they represented America’s single greatest asset at the time.9 The table at the bottom of the map would yield statewide figures, indicating that Virginia, because it had the largest number of slaves, required the greatest compensation; the map itself would further specify that the counties nearest Richmond, the darkest on this part of the map, would prove most expensive to compensate.
For both political and economic reasons, Lincoln hoped to convince the border states to agree first to gradual, compensated emancipation. It is in these loyal jurisdictions that the abolitionist cause might have taken hold more easily than in the deep South, and the small number of slaves there would prove relatively inexpensive to liberate in this transactional way. In a March 6, 1862, message to Congress, Lincoln urged legislators to provide incentives to states to agree to compensated emancipation as “one of the most efficient means of self-preservation” of the Union. He presented the effort as a simple matter of arithmetic: “In the mere financial, or pecuniary view, any member of Congress, with the census-tables and Treasury-reports before him, can readily see for himself how very soon the current expenditures for this war would purchase, at fair valuation, all the slaves named in any State.”10
In a follow-up letter sent eight days later to Senator James A. McDougall of California, Lincoln included a ledger detailing the slave population in each border state; at a rate of $400 per person, freeing the 1,798 slaves of Delaware would require $719,200, “less than one half-day’s cost of this war.” Freeing all of the border state and District of Columbia slaves would cost $173,048,800, slightly less than eighty-seven days of war expenses. Lincoln then asks, “Do you doubt that taking the initiatory steps on the part of those states and this District, would shorten the war more than eighty-seven days, and thus be an actual saving of the war expense?”11 Throughout that summer and into the fall of 1862, Lincoln pressed border state legislatures and the Congress to push ahead with gradual, compensated emancipation; even with an offer of financial compensation, a delayed implementation of twenty years or more, and a guarantee that the federal government would not interfere with the right of individual states to allow chattel slavery, not a single state legislature, and very few slaveholders in Washington, D.C., took up Lincoln’s piecemeal offer.
Even after the Emancipation Proclamation took effect in 1863, when plans for a gradual, compensated transition no longer applied, Lincoln may have viewed the Coast Survey map as something beyond a tool of military intelligence, moral stimulus, or financial accounting. In fact, the map may well have had a more sinister effect when judged by today’s standards. Revisionist scholars have long seen Lincoln as less than saintly; indeed, the historian George M. Fredrickson’s assessment leans heavily on the ambivalence toward Lincoln of W. E. B. Du Bois, who supplies the title to Big Enough to Be Inconsistent (2008), and of Frederick Douglass, whose nuanced appraisal concludes the slender volume. Before describing Douglass’s genuine appreciation of the martyr for Emancipation, Fredrickson shares the former slave’s more skeptical understanding of Lincoln, who stood, in Douglass’s words, “ready and willing at any time during the first years of his administration to deny, postpone, and sacrifice the rights of humanity in the colored people to promote the welfare of the white people of this country.”12 Lincoln often viewed slaves as abstract “problems” not in the Du Boisian sense, but rather as glitches in the political system, and the Coast Survey map assists anyone who wishes to view slavery in the abstract, as data points rendered with visual elegance.
The language of geospatial data analysis—its brute simplicity, its tendency to strip away all competing information in favor of a single spectrum of knowledge—suggests another “problem” in Lincoln’s Coast Survey map. The racialized subjects represented by the map had yet to achieve full citizenship, even in Lincoln’s estimation; their density in parts of the South, especially along the great corridor of the Mississippi Delta, symbolized a grave threat to the Union. When Lincoln appraised military efforts in light of geospatial demography, he saw “slaves” and (according to Carpenter at least) “heaps” of wartime bounty, not the free-thinking individualist portrayed by Douglass, not the slave become a man.13
Much of Douglass’s and Du Bois’s and eventually Fredrickson’s ambivalence toward Lincoln stems from the president’s scheme to colonize newly emancipated slaves in Africa, Haiti, or Central America,...
Table of contents
- Cover
- Title Page
- Copyright Page
- Dedication
- Contents
- Preface
- Introduction. The True Measure of a Renaissance
- 1. Measure for Measure for Measure: Three Eras in American Racial Census Taking
- 2. Harlem Society: Practicing Theory
- 3. Harlem Diversity: Nations within a Nation
- 4. Harlem Modernity: Inventing the New Negro
- 5. Harlem Geography: Race and the Spatial Imagination
- Epilogue. Census Geography and the Burdens of Representation
- Appendix: Race/Color Categories Employed by the U.S. Census, 1790–2010
- Notes
- Index
Frequently asked questions
Yes, you can cancel anytime from the Subscription tab in your account settings on the Perlego website. Your subscription will stay active until the end of your current billing period. Learn how to cancel your subscription
No, books cannot be downloaded as external files, such as PDFs, for use outside of Perlego. However, you can download books within the Perlego app for offline reading on mobile or tablet. Learn how to download books offline
Perlego offers two plans: Essential and Complete
- Essential is ideal for learners and professionals who enjoy exploring a wide range of subjects. Access the Essential Library with 800,000+ trusted titles and best-sellers across business, personal growth, and the humanities. Includes unlimited reading time and Standard Read Aloud voice.
- Complete: Perfect for advanced learners and researchers needing full, unrestricted access. Unlock 1.5M+ books across hundreds of subjects, including academic and specialized titles. The Complete Plan also includes advanced features like Premium Read Aloud and Research Assistant.
We are an online textbook subscription service, where you can get access to an entire online library for less than the price of a single book per month. With over 1.5 million books across 990+ topics, we’ve got you covered! Learn about our mission
Look out for the read-aloud symbol on your next book to see if you can listen to it. The read-aloud tool reads text aloud for you, highlighting the text as it is being read. You can pause it, speed it up and slow it down. Learn more about Read Aloud
Yes! You can use the Perlego app on both iOS and Android devices to read anytime, anywhere — even offline. Perfect for commutes or when you’re on the go.
Please note we cannot support devices running on iOS 13 and Android 7 or earlier. Learn more about using the app
Please note we cannot support devices running on iOS 13 and Android 7 or earlier. Learn more about using the app
Yes, you can access Measuring the Harlem Renaissance by Michael Soto in PDF and/or ePUB format, as well as other popular books in Literature & Literary Criticism. We have over 1.5 million books available in our catalogue for you to explore.