![]()
Chapter 1
Literacy and Academic Standards
Only 51 percent of 2005 ACT-tested high school graduates are ready for college-level reading.
—ACT, 2006, p. 1
In 2002, 28 percent of 4th-graders, 31 percent of 8th-graders, and 24 percent of 12th-graders performed at or above the Proficient level in writing.… Only 2 percent of students in each grade performed at Advanced.
—National Center for Education Statistics, 2005, p. 50
. . . . . . . . . . . . . . . . . . . .
1996 was a pivotal year. It was the year that Dolly the sheep was cloned from a cell taken from the udder of an adult sheep, the year of two U.S. space launches to Mars (Mars Global Surveyor and Mars Pathfinder), and the year newly reelected President Bill Clinton signed the Telecommunications Act, which helped wire public schools throughout the United States to the Internet. The year also marked a fundamental change in the ways that students chose to spend their free time.
In 1996, people in the United States still spent more time reading books than surfing the Internet. However, since 1996, as use of nonprint media has surged, reading—especially reading books—has been on the decline. An overwhelming volume of research (from media research firm Veronis Suhler Stevenson, the U.S. Census Bureau, the Department of Labor, the Kaiser Family Foundation, and the National Institute for the Humanities) indicates that time students spend reading is getting crowded out by time spent with electronic media—particularly, video games and, of course, television.
The Internet
The Internet serves as a vast, immediate source of information. Believe it or not, however, most adolescents do not go online to read Voltaire or Vonnegut, although we might wish they did. Recent studies of teen behavior on the Internet (Gross, 2004; Nielsen, 2005; Rainie & Horrigan, 2005) confirm that adolescents usually surf to find images and music, send e-mail or instant messages, or play online games. Very few students sign onto the Internet looking for reading material. A teen’s proclivity for seeking sound and images on the Internet holds true across categories of gender and race.
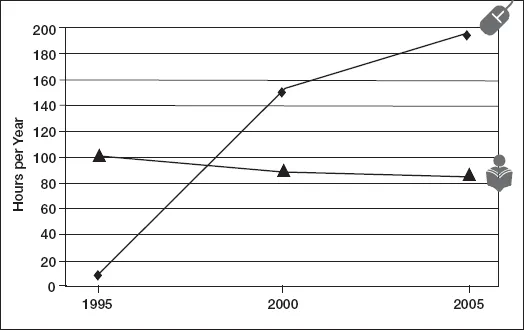
As indicated in Figure 1.1, the average number of hours per year spent on the Internet increased from around 10 hours in 1996 to 194 hours by 2005. During the same time frame, reading dropped from around 100 hours per year to 84 hours per year (Veronis Suhler Stevenson Communications Group, 2005). Corroborating data from the U.S. Census Bureau (2005) reveal that the smallest segment of book purchasers are age 25 and younger. Although people 35 to 54 years old accounted for about half of all book sales in 2003, people under 25 accounted for less than 4 percent, a percentage that has been dropping since 1996. A study sponsored by the National Endowment for the Arts (2004b) found a precipitous decline in the reading of literature. The steepest declines in reading literature were found among adolescents and young adults.
Over the past 20 years, young adults (18–34) have declined from being those most likely to read literature to those least likely.… The rate of decline for the youngest adults (18–24) is 55 percent greater than that of the total adult population. (p. ix)
Figure 1.1. Time Spent on Internet vs. Reading
Source: Data from 2004 Communications Industry Forecast and Report by Veronis Suhler Stevenson Communications Group, 2005, New York: Author. Adapted with permission.
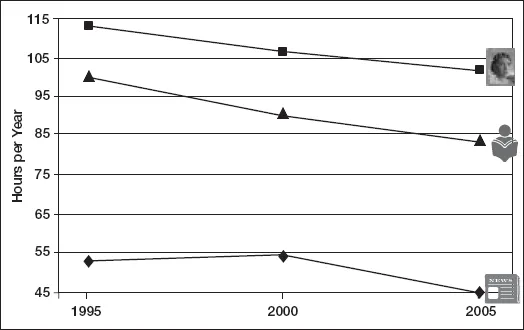
Video Games
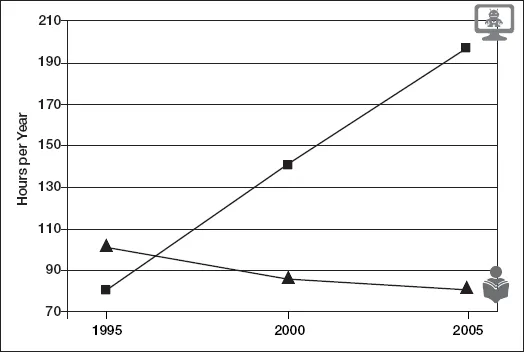
The Internet is not the only medium to integrate itself into the daily lives of students. The year 1996 also marked the launch of the Nintendo 64 game system in the United States. Soon thereafter, the video game industry began making billions of dollars more than the motion picture industry (Gaudiosi, 2003; Levine, 2006). In terms of hours spent per year (see Figure 1.2), video games have mirrored the rise of the Internet. Half of all people in the United States play video games for an average of 8 hours per week. Of course, video game players are predominantly children ages 5 to 18, who constitute more than half of game players (Entertainment Software Association, 2005).
Figure 1.2. Time Spent Playing Video Games vs. Reading
Source: Data from 2004 Communications Industry Forecast and Report by Veronis Suhler Stevenson Communications Group, 2005, New York: Author. Adapted with permission.
Last year, I became acquainted with a 17-year-old boy at a local high school who was a video game fanatic. Chris was a good-looking, popular boy who made As and Bs in his classes, had a girlfriend, and worked part time at a fast food restaurant on the weekends. Although Chris appeared to be a typical high school junior, his schedule was a little unusual. On Sunday through Thursday nights, he ate dinner with his family around 5 p.m. and went to sleep at 6 p.m. Then, he woke up at midnight, logged onto the Internet, and played video games until 7 the next morning when he would get ready for school. According to Chris, his “video game lifestyle” was fully supported by his parents, who seemed thankful that he had few other “bad habits.”
Like most video game players, Chris predicted that the time he spent playing video games would only increase over time (Entertainment Software Association, 2005), although that prospect seems difficult to fathom. When asked how long he planned on keeping up his odd schedule, Chris responded, “For as long as I can.”
If you try to start up a conversation with a group of students at school, do not mention books, writers, or the names of historical figures—they will not know them. To see students as young as 5 years old get animated and excited, bring up the titles of the latest video games. In their infancy, video games were developed for a predominantly male audience, but that has changed over the past few years, as females now account for almost half of the video game players (Entertainment Software Association, 2005). More than 228 million video games were sold in 2005, roughly two games for every U.S. household (U.S. Census Bureau, 2005). The largest growth in video games is expected to be in mobile and online gaming (Veronis Suhler Stevenson Communications Group, 2006). About half of American households own a Nintendo game, and the best-selling video game of all time is probably Super Mario Bros., which sold more than 40 million copies (Guinness World Records, 2008). However, when I recently brought up Mario to a group of middle school children, I was promptly informed that Mario, even in his recently updated form, is “still kind of cool, but way old” these days.
Television
As a medium, television has neared the point of saturation in the United States. On any given day, more than 90 percent of people in the United States tune in to television for at least a few hours. Of U.S. households, 99 percent have at least one television, and more than 70 percent have cable TV. Of those households with incomes over $50,000, cable TV is present in 90 percent of homes (Energy Information Administration, 2006). The average number of TV sets per household is 2.5, and two-thirds of U.S. homes have three or more sets. Over the past few years, the bedrooms of children have turned into media bunkers—68 percent of 8- to 18-year-olds have TVs there, 54 percent have VCRs or DVD players, and 37 percent have cable TV (Kaiser Family Foundation, 2005). The explosion of media available in the bedroom means that “Go to your room” has taken on a whole new meaning. No longer a threat, “Go to your room” has become a treat, equivalent to a trip to the movies or the local arcade in earlier eras.
Since 1996, television has expanded its domain from the privacy of the home into an ever-increasing number of venues. TV screens have become commonplace in classrooms, airports, restaurants, grocery stores, waiting rooms, sports venues, concert halls, and retail stores, and are being built into refrigerators, clock radios, and even wristwatches. Six big-screen TVs greet visitors at the entrance to the beautiful library in my hometown, and they stay on all day. There are four additional big-screen TVs in the hallway leading to the parking garage and a dozen or so other sets scattered throughout the library. In 1996, the average person in the United States watched 15.6 hours of television for every hour of reading; in 1999, television watching crept up to 16.2 hours for every hour of reading. By 2007, the ratio had increased to 21:1. That is, for every hour spent reading, more than 21 hours are spent watching television. The ratio is expected to continue to escalate, although a ceiling seems inevitable (Veronis Suhler Stevenson Communications Group, 2005).
The Move Away from Print
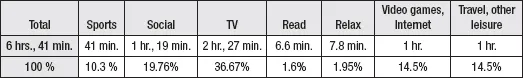
Data on U.S. leisure and sports habits is gathered periodically by the U.S. Bureau of Labor Statistics. Figure 1.3 offers a summary of average hours per day spent in leisure and sports activities for young people ages 15 to 19 in 2006 in the United States.
Figure 1.3. Average Hours per Day Spent in Leisure and Sports Activities
Source: From Time-use survey, Table 11, by U.S. Bureau of Labor Statistics, 2008, Washington, DC. Retrieved April 3, 2008 from http://www.bls.gov/news.release/atust11.htm
Perhaps the most startling finding from Figure 1.3 is not the dominance of TV, but the small portion of time given to reading as a leisure time activity during a typical day—6.6 minutes. These 15- to 19-year-olds spent over 900 percent more time (60 minutes) playing on the computer than reading (6.6 minutes), which is consistent with data gathered by Veronis Suhler Stevenson (2005), as shown in Figure 1.1.
Figure 1.4 shows downward trends in hours spent with print materials—books, magazines, and newspapers.
Figure 1.4. Trends in Time Spent Reading Magazines, Books, and Newspapers
Source: Data from 2004 Communications Industry Forecast and Report by Veronis Suhler Stevenson Communications Group, 2005, New York: Author. Adapted with permission.
The Quality of Student Writing
The decline of reading is enough to turn some educators into headshaking curmudgeons. In response to the decline of reading (especially during adolescence), some recent initiatives, such as the federal government’s High School Initiative (Chaddock, 2005; McGrath, 2005; Olson, 2005), seek to enhance achievement among high school students through a reemphasis on reading and writing.
The National Assessment of Educational Progress has been testing students on their writing abilities since 1969. Although there have been fluctuations—improvements and declines in the performance of a particular age group or ethnic group from time to time—results in the NAEP have been surprisingly consistent over time. Remember that the NAEP classifies student performance as being advanced, proficient, basic, and below basic. Ever since the administration of the first tests, only a tiny proportion of students—1 or 2 percent—score at the advanced level, a level at which writing should be “detailed and fully developed … well crafted and coherent,” with “rich and compelling language, precise word choice, and variety in sentence structure” (NAEP, 2003, p. 9).
In 2002, 20 to 29 percent of students could write at the proficient level, which means that they included “details that support and develop the main idea of the piece” through “precise language and variety in sentence structure to engage the audience they are expected to address” (NAEP, 2003, p. 9). Incredibly, as many as 80 percent of students could only write at the basic or below basic level.
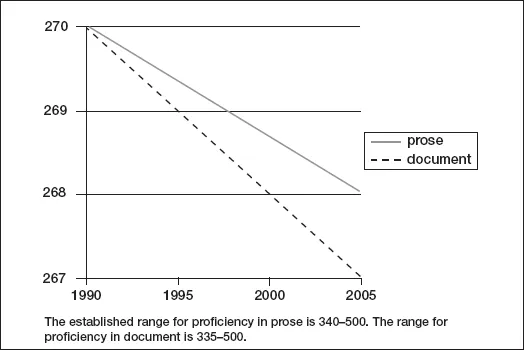
Another alarming statistic surfaced in literacy assessment trends. The National Assessment of Adult Literacy (Kutner et al., 2007) found that the number of 16- to 18-year-olds considered literate actually has decreased since 1992. Figure 1.5 illustrates the average score declines.
Figure 1.5. Performance of 16- to 18-Year-Olds on the National Assessment of Adult Literacy
Source: From Literacy in everyday life by M. Kutner, E. Greenberg, Y. Jin, B. Boyle, Y. Hsu, & E. Dunleavey, 2007, Washington, DC: U.S. Department of Education.
Another finding was that the literacy of college graduates nosedived during the same period. “The percentage of college graduates with proficient literacy decreased from 40 percent in 1992 to 31 percent in 2003” (National Assessment of Adult Literacy, 2005, p. 15).
Books Today
In decades past, the unveiling of a new work by a familiar author was a major event. Some select books, particularly those that gained widespread readership, might have been optioned to Hollywood producers and eventually adapted for film. Over the past few years, however, the relationship between books and films has been transmogrified. Today, rather than provide inspiration for films, books have become subsidiary to the public relations blitz that occurs with the release of a new film. If asked to guess the title of the best-selling children’s book of 2004, most of us would be correct in assuming it was Harry Potter and the Order of the Phoenix by J. K. Rowling. And so it was—Harry owned the top spot. But in examining the other titles in the top 10 best-selling books of 2004, the number of film tie-ins is astounding (Infoplease, 2008).
10 Best-Selling Children’s Books (Paperback), 2004
- Harry Potter and the Order of the Phoenix by J. K. Rowling
- Disney/Pixar’s The Incredibles by Irene Trimble
- Spider-Man 2: Spider-Man Versus Doc Ock by Acton Figueroa; illustrated by Jesus R...