eBook - ePub
Gaming Globally
Production, Play, and Place
- English
- ePUB (mobile friendly)
- Available on iOS & Android
eBook - ePub
About this book
Video games are inherently transnational by virtue of industrial, textual, and player practices. The contributors touch upon nations not usually examined by game studies - including the former Czechoslovakia, Turkey, India, and Brazil - and also add new perspectives to the global hubs of China, Singapore, Australia, Japan, and the United States.
Trusted by 375,005 students
Access to over 1.5 million titles for a fair monthly price.
Study more efficiently using our study tools.
Information
Print ISBN
9781137006325
Subtopic
Cultural & Social AnthropologyPart I
Macro
1
Who Plays, Who Pays? Mapping Video Game Production and Consumption Globally
When the seventh generation of video game consoles began to hit the market in 2005 and 2006, it was quickly apparent that while the audience for video games and the industry producing them was increasingly stable, the role of the machines and the games they played was changing. Stories covering them appeared across the spectrum of mainstream media in North America, Europe, and Japan, and what was covered went beyond discussions of hardware functionality and questions of the effects of video game playing on children to discussions of video games as a part of daily life. Video game products were becoming mainstream, adapting a variety of functions and incorporating an increasingly sophisticated aesthetic that was designed to appeal to a broad audience.
In part, these changes were due to shifts in video game audiences themselves. By 2005, video game audiences were expanding, growing older and more diverse. In the United States, estimates suggest that almost 70 percent of households play video games on either a personal computer or console. In contrast to persistent stereotypes about teenagers playing alone in a basement, games are also quite popular with an older crow; the average player age has risen from 29 years in 2004 to 35 years by 2010. Estimates also suggest that at least 17 percent of all US game players are over the age of 50 years (Emeling 2004; ESA 2005 and 2010).
Similarly, as games have become more mainstream, the European audience for them has grown considerably. One study, conducted by the International Software Federation of Europe, found that 37 percent of people in the United Kingdom between the ages of 16 and 49 years play video games regularly, while in Spain and Finland, 28 percent of the population actively plays video games. The average video game player in the United Kingdom is 33 years old and over 80 percent of players are aged 20 years or over. In Spain, the average player is 26 years old, and in Finland, 30 years old (Emeling 2004; Nielsen Games 2008). This growth and popularity has also resulted in increasing amounts of software production coming to the region.
In Australia, the average age of game players was 28 years in 2007, up from 25 years in 2005 (IEAA 2005 and 2007), and estimates suggest that 79 percent of households play video games (IEAA 2007). Globally, the average age for a video game player in 2005 was 30 years (Wingfield and Marr 2005).
Given the numbers of households with frequent game players, video game consumption has also risen with the seventh-generation console and the rapid dissemination of mobile gaming. In 2005, video games were competing with more established media, and within a few years, global game sales surpassed Hollywood’s box office (Nichols 2008). The video game industry earned approximately US$77 billion globally in 2010. Hardware sales accounted for roughly US$22 billion, while software sales made up the remaining US$55 billion (Global Video Games Investment Review 2011). However, unlike Hollywood and in spite of the video game industry’s own rhetoric, games sales drew only a fraction of the potential global market. A majority of game sales are divided between three markets: North America, Europe, and Japan. Figure 1.1 highlights this pattern, mapping a majority of video game hardware sales globally. As it shows, roughly 80 percent of all video game sales are drawn from those three markets.
In Japan, the second largest market for video games worldwide, almost 80 percent of households play video games. As such, Japan provided a remarkable test market for video games in the first decades of the industry, though its influence has been seen as waning more recently. In spite of this, it has been the first market for the release of many games products (Croal and Itoi 2004). No doubt, much of this is because Japan is home to two of the major companies in the industry: Nintendo and Sony. Games are also very popular in other Asian countries, with estimates that as much as 80 percent of South Korean households own at least one computer and use them for games. South Korea has become increasingly important in the production of online games; this propelled industry sales of US$1.7 billion in 2006 (Caldwell 2006).
The global nature of video games goes beyond consumption, of course. The production of both the software, which has been the focus of video game studies, and the hardware, which has been largely left out in the theoretical cold, represent substantial global processes. Not surprisingly, there is considerable distinction between the software and hardware sides of the industry. This chapter examines video game hardware production, focusing on Microsoft’s Xbox 360, to demonstrate the complexity of the process, to clarify the range of labor involved within the industry, and to help problematize the entire range of global video game consumption.
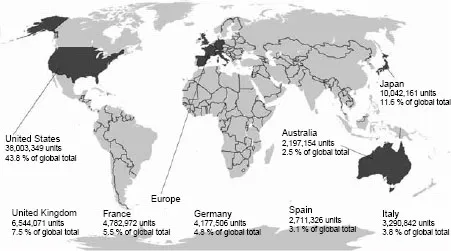
Figure 1.1 Global hardware consumption, 2009.
The Known World: The Video Game Industry and Economics
This isn’t just a story about Microsoft. It’s also a story about a sea change in . . . culture, which has embraced video games, formerly a disposable hobby, as a vital force in pop culture. (Lev Grossman, Technology Reporter for TIME Magazine [Grossman 2005])
Because of this growth in the audience, by the time of the seventh generation’s emergence—represented by Microsoft’s Xbox 360, Nintendo’s Wii, and Sony’s PlayStation 3—the industry itself was relatively stable. It had not only developed a structure and standard practices, but also a number of dominant players as well. The video game industry can be broken down into four major industrial sectors: software development, software publishing, hardware production, and retail (D. Williams 2002; Kerr 2006). As was the case when the previous console generation was released around the year 2000, four companies dominated the industry producing the seventh generation. While three of these four companies are primarily console producers—Microsoft, Nintendo, and Sony—they have maintained a hand in virtually every sector of the industry. A fourth company, Electronic Arts (EA), dominates software publishing.
Most studies of the industry’s economics—particularly its labor practices—have focused on the software development sector and the problems it represents. In part, this owes to a reliance on the creative industries and cultural industries approaches, which tend to emphasize white-collar and information labor forms for work over others forms, such as manufacturing and blue-collar labor (Wasko and Meehan 2011). What these approaches have shown, however, is that labor within the development side is heavily gendered, prone to workplace crunch times, and to a strict division of labor that is both segregated and entrenched in the industry’s culture (Consalvo 2008; Fullerton et al. 2008; Prescott and Bogg 2011a and 2011b).
Drawing particularly on the political economic approach, additional research has found considerable inequality across industrial and international lines as well. These studies, which also largely focused on software development, point to a transnational division of labor that not only reifies gendered patterns within the industry, but also relies on a long-established division of cultural labor between economic haves and have-nots (Dyer-Witheford 1999 and 2002; Dyer-Witheford and De Peuter 2006 and 2009; Kerr 2006; Kerr and Flynn 2002; T. Miller 2008). These studies see the products themselves—the software and hardware manufactured around the world for a relatively small, privileged few in the wealthiest markets—as embodied examples of existing social relations. These social relations both drive demand for the products while perpetuating long-standing inequalities.
With this in mind, it should not be surprising that the major areas for video game development are the same areas that account for most of their sales. For example, Japan, where it is estimated that 80 percent of households play video games, is also the second largest market for games and one of the crucial centers for game development and testing (Aoyama and Izushi 2004; Guth 2001). As has already been noted, two of the biggest companies in the industry, Sony and Nintendo, are based in Japan and owe much of their success to the market there. As such, for many years, the Japanese market proved a remarkable measuring stick for global game success (Nelson 1990).
Companies working on the production of video game software can be divided into two sectors: developers and publishers, though larger companies may be involved in both. Developers tend to be smaller organizations, often as small as 12–20 individuals. These companies may focus on creating individual elements of a game or whole games themselves. Kerr (2006) offers a useful categorization of developers. First-party developers are development companies owned and integrated into a publishing company; second-party developers create games based on concepts developed by or licensed through publishers; finally, third-party developers create their own projects that they then attempt to sell to publishers. Market concentration—particularly via integration—has meant, however, that third-party developers building game concepts on new intellectual property have had an increasingly difficult time getting original games into the market because licensed properties and franchise games are seen as less risky (Van Slyke 2008). Sony, Nintendo, and EA make up more than 50 percent of the software market. During successful years, it is not unusual to see large numbers of development studios purchased by publishers, which are sold, merged, or closed during lean economic times. Similarly, when companies outside the video game industry—for example, Hollywood studios—attempt to move into the industry, it is typically through purchase or establishment of development studios. In contrast, publishers tend to be larger companies affiliated with multiple developers, most typically through first- or second-party relationships. Because of this, it is not unheard of for hardware developers to vertically integrate, purchasing publishers and studios of their own. Both Microsoft and Sony are examples of this. It is the publisher’s role to get software to retailers and onto particular gaming platforms, such as consoles, PCs, mobile phones, and so on. This also means that publishers, rather than developers, are typically in charge of negotiating contracts with hardware manufacturers, unless, of course, they are themselves also hardware manufacturers. This has resulted in heavy concentration within the industry. Four companies—EA, Microsoft, Nintendo, and Sony—typically earn a majority of the industry’s revenues, and this concentration is reflected in the participation of top-selling games. As Figure 1.2 shows, the number of countries involved in some aspect of the development or publishing of the best-selling video games of all time is limited to just four countries.
Game production may take between 14 months and 3 years (Levine 2005). For Triple-A games, the industry equivalent of a blockbuster film, cost of development for the seventh-generation console often exceeds US$10 million, excluding the additional costs of marketing and promotion (Guth, Wingfield, and Divorack 2005; Richtel 2005). Analysts expect this figure to grow, averaging US$15–US$20 million before the next generation of consoles are released (Grover et al. 2005; Guth 2005). In fact, such figures have already been seen and surpassed; it is estimated that the cost to produce and market Microsoft’s Halo 3 was over US$60 million (Johnson 2007).
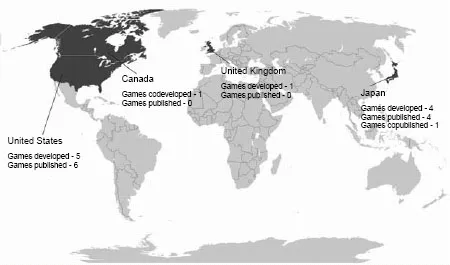
Figure 1.2 Global participation in software development and publishing of top-ten video games of all time.
Source: Tito 2010; “Top Videogame Publishers 2008” 2009; and VGChartz 2008b
This rising cost can be attributed, in part, to the growing complexity of the games themselves. Manufacturing the physical commodity is comparable in price to manufacturing a DVD or CD—mere pennies. This means that the majority of the cost of game development is from the labor needed to manufacture the game’s code itself. This, in turn, makes the labor market for video games more volatile than other sectors of the industry, especially during recessed economic times for entertainment products. In 2000, the US games industry is estimated to have paid approximately US$7.2 billion in wages. At that time, games companies in the United States employed over than 220,000 people, more than any other country (Aoyama and Izushi 2004). For the first decade of the millennium, that number continued to grow robustly, but recently, the labor market for game development has slowed, reflecting downsizing occurring across the entertainment sectors. At the same time, salaries have grown slowly. In the United States, salaries ranged from around US$20,000 to slightly over US$100,000 in the year 2000, but by 2011, they ranged from around US$30,000 to more than US$125,000, depending upon the sector and one’s experience within the industry (Deutsch 2002; P. Miller 2012; Zito 2000). For example, in 2011, game d...
Table of contents
- Cover
- Title Page
- Copyright
- Contents
- List of Figures and Tables
- Notes on Contributors
- Introduction
- Part I Macro
- Part II Play Practices
- Part III Localization
- Part IV Strategies
- Index
Frequently asked questions
Yes, you can cancel anytime from the Subscription tab in your account settings on the Perlego website. Your subscription will stay active until the end of your current billing period. Learn how to cancel your subscription
No, books cannot be downloaded as external files, such as PDFs, for use outside of Perlego. However, you can download books within the Perlego app for offline reading on mobile or tablet. Learn how to download books offline
We are an online textbook subscription service, where you can get access to an entire online library for less than the price of a single book per month. With over 1.5 million books across 990+ topics, we’ve got you covered! Learn about our mission
Look out for the read-aloud symbol on your next book to see if you can listen to it. The read-aloud tool reads text aloud for you, highlighting the text as it is being read. You can pause it, speed it up and slow it down. Learn more about Read Aloud
Yes! You can use the Perlego app on both iOS and Android devices to read anytime, anywhere — even offline. Perfect for commutes or when you’re on the go.
Please note we cannot support devices running on iOS 13 and Android 7 or earlier. Learn more about using the app
Please note we cannot support devices running on iOS 13 and Android 7 or earlier. Learn more about using the app
Yes, you can access Gaming Globally by N. Huntemann, B. Aslinger, N. Huntemann,B. Aslinger in PDF and/or ePUB format. We have over 1.5 million books available in our catalogue for you to explore.