
eBook - ePub
Applied Financial Macroeconomics and Investment Strategy
A Practitioner’s Guide to Tactical Asset Allocation
- English
- ePUB (mobile friendly)
- Available on iOS & Android
eBook - ePub
Applied Financial Macroeconomics and Investment Strategy
A Practitioner’s Guide to Tactical Asset Allocation
About this book
The absolute and relative performance of various asset classes is systematically related to macroeconomic trends. In this new book, Robert McGee provides a thorough guide to each stage of the business cycle and analyzes the investment implications using real-world examples linking economic dynamics to investment results.
Trusted by 375,005 students
Access to over 1.5 million titles for a fair monthly price.
Study more efficiently using our study tools.
Information
1
Cycles and Trends: History Does Not Repeat Itself, but It Does Rhyme
The daily news shapes the public conversation and dominates media discussion of financial market and economic trends. For example, early every month, when the US Department of Labor reports the jobs growth number for the previous month, a flood of commentary attempts to judge the strength of the labor market with a myopic focus on that particular number.
This focus on a snapshot in time outside the broader context often creates a consensus of meaningless information. When payrolls grow by 160,000 in a month when 200,000 jobs were expected, a lot of negative commentary follows, as if a 40,000 miss tells us something about the strength of the labor market. Every month in the United States, several million new jobs are created, and several million old jobs end. A net gain of 160,000 or 200,000 is a very small percentage of that massive churn, and the 40,000 difference is a statistically insignificant piece of information. Yet the reporting that the public hears inevitably focuses on this meaningless and often misleading “noise” rather than the more important underlying trend. In fact, given the wide confidence intervals around the initial estimates, subsequent revisions commonly change that initial interpretation by 180 degrees. By that time, however, the news has moved on to the noise in the next month’s estimate.
This misinterpretation of noise as “signal” confounds professionals as well as the public. Market professionals pontificate in the media as if there is an important kernel of information in the latest noise. An extreme example of this pattern occurred in September 2013, when the August payroll number was first reported as a superficially disappointing 169,000 increase. This was taken as a sign the economy and labor market were softening. The Federal Reserve had set the markets up to expect an imminent decision to taper its bond-buying program known as quantitative easing (QE3) based on the substantial labor market improvement over the prior year. Instead, the Fed surprised the markets by deciding to postpone the tapering based at least partly on worries created by the negative noise in the August jobs data. With more comprehensive data, the payroll gain was subsequently revised sharply higher to show a robust gain over 200,000, and gross domestic product (GDP) growth for the quarter was also reported well above consensus expectations at just over 4 percent, numbers that would have easily justified a September tapering had the Fed known them at the time. By its December meeting, the clarified picture of a stronger labor market contributed to the Fed’s decision to vote in favor of reducing its QE3 bond-buying program. This about-face surprised market participants who had by then talked themselves into a much-delayed tapering schedule. This example illustrates how noise in the data creates volatility in markets. While traders exploit these misinterpretations, longer-term investors need to look through the noise to the underlying signals from the data to make sensible investment decisions.
The explosion of information made possible by modern technology has intensified the need to develop methods for better analysis and interpretation of data. In addition to useful information, the blogosphere has also created a platform for ill-informed pseudo experts of all sorts. Bad analysis has proliferated with the ease of access to information and expanded channels for mass communication, contributing to waves of pessimism or optimism in financial markets. A misleading focus on the noise in the data to the detriment of the signal is just one example of the pitfalls of the Information Age. Indeed, because noise is random, it allows commentators to always have a basis for advocating both sides of an issue. Negative noise supports the weak economy viewpoint, while positive noise supports the strong economy view. That’s why on any given day, the financial news airwaves sow confusion. The bulls and the bears both are talking their respective cases “knowledgeably,” with rationales culled selectively from the noise in the data. Successful investors must distill the signal from the noise.
Cycle and trend analyses take advantage of the information explosion to extract signals from noisy data. They attempt to find useful patterns for anticipating future developments by throwing out the noise and using the remaining signal. Exploiting systematic relationships between cycles in asset returns and economic variables is useful for tactical asset allocation. Likewise, exploiting relationships between trends in asset returns and economic variables is also useful. However, this cannot be done mechanically, without regard to the underlying economic and policy backdrop. For example, different monetary policy regimes can create or reverse particular trends in inflation and interest rates, which in turn affect trends in asset-class performance, both relative and absolute.
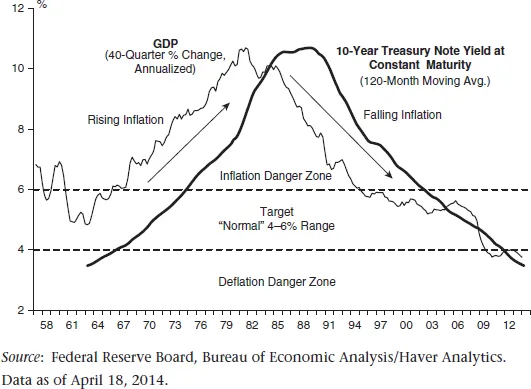
Trends are often segments of very long cycles. The rise of inflation from the 1960s to the early 1980s lasted long enough to be regarded as a trend by investors during that time. Likewise, the decline in inflation since the early 1980s has been a key trend affecting the relative performance of various asset classes. For example, it drove the long bull market in bonds.
From a longer-term perspective, these two trends—rising inflation (1965–1982) and falling inflation (1982–2008)—can be regarded as a very long cycle that restored price stability after it was disrupted in the 1960s (Exhibit 1.1). Assuming monetary policy continues to preempt deflationary forces, inflation has made a round-trip back to subdued 1950s levels. Looking forward, if the Fed remains committed to price stability around 2 percent, inflation would largely be cyclical around a trendless 2-percent rate. This example illustrates the importance of historical and fundamental knowledge about what causes inflation as well as quantitative modeling of trends and cycles.
Exhibit 1.1 Round-Trip Back to Normal
The ongoing evolution of the structure of the economy, combined with the fact that policy settings differ from cycle to cycle and some key relationships may be different in each cycle, help explain Milton Friedman’s famous maxim that the lag between a change in monetary policy and its effect on the economy “is long and variable.” It is also the case that the policy-impact lag varies for different parts of the economy. For example, real GDP responds more quickly to monetary stimulus than inflation, which exhibits more inertia. Given the variability in lags from cycle to cycle and the difference in lags across economic variables, it is not surprising that econometric models based on statistical averages over multiple cycles have a hard time forecasting accurately. Add to this the fact that lags in the impact of one variable on another also fluctuate with changes in preconditions and structure, and it is not hard to see why forecast models often have so much difficulty. This explains why well-informed consideration of “what’s different” about a particular cycle can sometimes be more useful than the best econometric models.
That said, the limitations of models do not mean that they should be abandoned. If they are, the result is what we see in the mass media, in which both sides of any particular issue about the economic outlook seem to have compelling stories to tell. Models add insight to help distinguish signal from noise. While not precise by any stretch of the imagination, they can be very useful for getting the direction of change right. By itself, that can be a big advantage, especially when the market is looking the other way or is extremely uncertain about direction.
These considerations are behind the approach taken in this book. Rather than a formal modeling or theoretical approach to these issues, the method is to show how the art of economic forecasting can be applied usefully to investment strategy. This means we have to steer clear of precise mathematical definitions and organize our vocabulary around concepts that are fuzzier but that better serve the purpose for which they are intended. With that in mind, let’s talk about cycles and trends.
Time horizon and frequency of observation are necessary assumptions for any practical application of data to the concepts of cycle and trends. Cycles in interest rates, profits, equity prices, and economic growth are generally related to the underlying business cycle, which we discuss in depth in the next chapter. As with all the cycles we discuss, business cycles vary in duration. Since World War II, for example, expansions have been longer and recessions less frequent than was the case for the business cycles in the prior century. We will discuss why that has been the case in chapter 2. With the time frame of a business cycle in mind, the easiest way to define a cycle is the pattern of movement in an economic or financial variable, such as corporate profits, over the course of an economic expansion and recession. Profits generally rise during expansions and fall during recessions.
In some cases, cycles in particular variables do not mesh with the business cycle. For example, consumption spending and housing investment grew through the 2001 recession instead of contracting in the usual fashion. In the case of housing, it grew from 1995 to 2006 throughout two business cycles. This allowed an unusually long time for excesses to accumulate. Generally falling interest rates, easy mortgage-credit conditions, and the pent-up demand left over from the deep housing recession in the early 1990s helped power residential real estate through the 2001 recession. It was the collapse in technology-sector investment that was the main weak point in that downturn.
This illustrates the flexibility necessary to use the term cycle. Generally, it can be regarded as a period in which a particular variable, say GDP, starts rising, continues to rise, and then starts to decline and bottoms before a new ascent. Similarly, an interest-rate cycle begins when rates rise off the prior cycle’s low point, then peak and fall before rising in the next cycle. Within a business cycle, which will generally be our reference cycle, there can be multiple cycles in some of the variables we discuss. For this reason, and because it is a good framework for investment strategy, we will usually orient cycles of particular variables over the business cycle defined by the National Bureau of Economic Research (NBER) cycle-dating committee.
For the momentum trader, a trend can be six months or less. For a historian, it may span centuries. Here we use the term to refer to periods when a variable of interest is moving up or down through at least a few business cycles. The example of inflation (up 1965–1982, down 1982–2008) illustrates the practical application of the trend concept. Another reason why econometric modeling is limited is that variables switch from trending (or nonstationary) to cyclical (stationary), and the statistical procedures that apply depend on this distinction. However, timing the distinction right can be difficult when structural and policy shifts move a variable from one category to the other. For example, inflation was a nonstationary variable during the period when it trended up and down. It is not a coincidence that econometric tests for stationarity got a lot more attention starting in the 1970s. That’s when some key macroeconomic variables were becoming nonstationary. We believe inflation has recently become stationary as part of the Fed’s successful shift to targeting a 2-percent rate.
Some methodological considerations: Economists express their sense of humor by using decimal points
Applying econometric forecasting to investment strategy puts more focus on what works for that objective compared to more academic deductive theoretical reasoning. In the latter case, economists are concerned with formulating theories and testing them empirically. While some microeconomic theories lend themselves to relatively precise empirical estimations, macroeconomic theories are more likely to have conceptual and measurement issues, making modeling less reliable.
Aggregate measures, such as GDP and employment, are much harder to tally, or even define, compared, for example, to direct measures of individual company metrics. There are exceptions, especially with price data, including interest rates, in which direct measurement is easy. Generally, financial data are more timely and precise than aggregate macro data. Arguably, finance theory is also more representative of the underlying phenomena that determine asset values, compared to, say, macroeconomic theories of what determines GDP. Put another way, there is more room for dispute in macroeconomics than finance.
In the early days of building big econometric models, there was more of a sense that a stable structure through time could represent macroeconomic variables and provide a good basis for forecasting. By the 1970s, it was becoming clear that this was a naive expectation, as more focus turned to the sort of issues raised by the Lucas critique, which argues that it is naive to try to predict the effects of a change in economic policy entirely on the basis of a relationship observed in historical data, especially highly aggregated historical data.
One example of why this is the case is embodied in Goodhart’s Law, which refers to the notion that “when a measure becomes a policy target, it ceases to be a good measure.” This is a social science variant of the Heisenberg uncertainty principle, the idea that the more closely we can measure the position of a subatomic particle, the less precisely we can measure its momentum. Put another way, if we get very close to an object in order to describe it, we lose perspective on how it fits into the dynamics of its broader environment. We abandon that dynamic perspective to move in on a fixed perspective that maximizes our view of the object itself. Importantly, however, by doing this, we can also change the dynamics (e.g., the effect of the policy target on the economy). These measurement and conceptual difficulties with traditional economic forecasting and applied macroeconomics are probably behind the fact that investment strategy professionals tend to lean more toward the camp of economic forecasting that comes out of the empirical business-cycle approach to following the economy. Basically, the business-cycle approach has proved much more useful for investment strategy than theoretical models.
This distinction between the deductive theoretical approach to macroeconomics and the inductive business-cycle approach is illustrated by Greg Mankiw’s review of Alan Greenspan’s book The Map and the Territory: Risk, Human Nature and the Future of Forecasting. Rather than examining Greenspan’s ideas, Mankiw focuses on the fact that the former Fed chairman is different from what passes as a traditional academic economist: “he is driven less by theory, more by data and practical experience.”1
Greenspan’s practical bent is a good way to describe how investment strategists use economics. Greenspan was a student of Arthur Burns and Geoffrey Moore, who both built on the work of Wesley Mitchell and Simon Kuznets, who guided the NBER in its first decades with a focus on measurement, empirical work, and business cycles. Over the years, in academia, the business-cycle focus of the NBER has largely been overshadowed by the sort of macroeconomics that deductive theoretical economists prefer. Milton Friedman was an interesting exception to this parallel universe of macroeconomists, achieving great success in both realms. His Monetary History, written with Anna Schwartz, was heavily influenced by the business-cycle approach to macroeconomics that he learned from Burns, who encouraged Friedman to look at monetary policy from a business-cycle perspective.
Because the business-cycle approach to macroeconomics has lost influence in the academic community, investment strategy is generally learned practically on the job by people from various backgrounds. As noted above, this book tries to help with that process. Ultimately, the business-cycle approach becomes a crucial element for applying economic forecasting to investment strategy.
What does this mean in practice?
A flexible business-cycle-focused approach tends to characterize the way in which macro strategists forecast the economic outlook. It is not surprising that the Federal Reserve’s policy-making committee, the Federal Open Market Committee (FOMC), also relies heavily on this approach, as can be seen by reading the minutes of their meetings....
Table of contents
- Cover
- Title
- 1 Cycles and Trends: History Does Not Repeat Itself, but It Does Rhyme
- 2 The Business Cycle
- 3 Monetary Policy
- 4 Bonds and Credit
- 5 Equities and Profits
- 6 Commodities and Tangible Assets
- 7 Investing for Long-Term Change: Challenging the Conventional Wisdom
- 8 Lessons Learned from the Financial Crisis
- Bibliography
- Index
Frequently asked questions
Yes, you can cancel anytime from the Subscription tab in your account settings on the Perlego website. Your subscription will stay active until the end of your current billing period. Learn how to cancel your subscription
No, books cannot be downloaded as external files, such as PDFs, for use outside of Perlego. However, you can download books within the Perlego app for offline reading on mobile or tablet. Learn how to download books offline
We are an online textbook subscription service, where you can get access to an entire online library for less than the price of a single book per month. With over 1.5 million books across 990+ topics, we’ve got you covered! Learn about our mission
Look out for the read-aloud symbol on your next book to see if you can listen to it. The read-aloud tool reads text aloud for you, highlighting the text as it is being read. You can pause it, speed it up and slow it down. Learn more about Read Aloud
Yes! You can use the Perlego app on both iOS and Android devices to read anytime, anywhere — even offline. Perfect for commutes or when you’re on the go.
Please note we cannot support devices running on iOS 13 and Android 7 or earlier. Learn more about using the app
Please note we cannot support devices running on iOS 13 and Android 7 or earlier. Learn more about using the app
Yes, you can access Applied Financial Macroeconomics and Investment Strategy by Robert T. McGee in PDF and/or ePUB format, as well as other popular books in Economics & Finance. We have over 1.5 million books available in our catalogue for you to explore.