The Social Effects of FDI on Multinational Companies and Domestic Firms compares and contrasts wages, working conditions and industrial relations processes in multinational and domestic companies. This book is an effort to map the social effects of FDI in a number of EU member states, in relation to the prevailing patterns of internationalization.

eBook - ePub
Multinational Companies and Domestic Firms in Europe
Comparing Wages, Working Conditions and Industrial Relations
- English
- ePUB (mobile friendly)
- Available on iOS & Android
eBook - ePub
Multinational Companies and Domestic Firms in Europe
Comparing Wages, Working Conditions and Industrial Relations
About this book
Trusted by 375,005 students
Access to over 1.5 million titles for a fair monthly price.
Study more efficiently using our study tools.
Information
1
The Wage and Employment Effects of Foreign Direct Investment
1.1Introduction
In our globalizing world, the activities of multinational enterprises (MNEs) have increasingly pervaded many economies. In the 1980s and 1990s, foreign direct investment (FDI),1 the main mechanism for the international expansion for MNEs, showed unequalled annual growth rates between 20 and 40 per cent. This came to an end in the new millennium when a highly unstable growth pattern began to emerge. In 2001, influenced by the economic downturn in the US, the upward trend in FDI turned abruptly into a steep fall of over 40 per cent. Then, after three ailing years, FDI growth rebounded strongly between 2005 and 2007, with yearly increases of between 33 and 47 per cent (United Nations Conference on Trade and Development [UNCTAD] 2001, 2005, 2007, 2008).2 However, while FDI reached a worldwide peak in 2007, in the course of that year unmistakable signs of a slowdown appeared. The UNCTAD World Investment Report 2010 noted that worldwide FDI inflows had fallen progressively by 16 per cent in 2008 and 37 per cent in 2009. The report concluded that the economic and financial crisis significantly affected the operations of MNEs abroad in 2008–2009. However, it also pointed out that the decline of sales and value added of their foreign affiliates was less than the decline of world economic activity (UNCTAD 2010, 16). As a result, in 2010 the share of foreign affiliates’ value added reached an historic high of nearly 11 per cent of the world’s gross domestic product (GDP). Previously this share had grown from 4.5 per cent in 1990 to 9.5 per cent in 2000. In 2010 the value added by the international production of MNEs accounted for around 40 per cent of MNEs’ total value added, up from around 35 per cent in 2005. This showed that the persistent expansion of intra-firm trade continued to be dominated by MNEs. In 2010, worldwide FDI flows recovered by 14 per cent, a much stronger growth than UNCTAD had earlier assumed (UNCTAD 2012).3 UNCTAD had already noted that this expansion reflected the consistently high profits (rates of return) that MNEs made on their FDI – which had grown back to an average of 7.3 per cent in 2010, after a one-year dip during the crisis (UNCTAD 2011, 25).4 Thus, the global crisis slowed down but did not halt the growing internationalization of production and commercial services, while profitability was restored in no time.
It should be noted that MNEs are not the only vehicles for FDI; individuals, governments, regional and international organizations as well as special funds are also engaged in FDI. In 2009, FDI by special funds rose to over 10 per cent of global FDI flows, up from less than 7 per cent in 2000 – albeit down from 22 per cent in the peak year of 2007 (UNCTAD 2010, 13). These special funds, as they are called by UNCTAD, are private equity funds as well as sovereign wealth funds set up by or on behalf of nation states. We must also recognize that FDI stocks and inward FDI flows largely overstate the productive activities of MNE affiliates in countries with tax regimes that encourage tax evasion. This is particularly evident in countries that function as tax havens, exemplified in the EU by the Netherlands (see Box 1.1). In contrast, MNE affiliates may finance activities by raising external funds locally, notably in host countries with mature stock and bond markets. Where this is the case, FDI stocks underestimate actual MNE affiliate activity (Beugelsdijk et al. 2010). Moreover, as will be elaborated in the next section, MNEs also control production and trade via arm’s length contracts with foreign suppliers that often take place without substantial FDI flows.
The UNCTAD World Investment Report 2011 observed that ‘the post-crisis business environment is still beset by uncertainties’, and noted that MNEs were likely to remain relatively cautious regarding their investment plans (UNCTAD 2011, xii, 16). This was definitely true for their plans regarding FDI in European Union (EU) member states. The fall in FDI inward and outward flows in and from EU countries during the crisis initially about equalled worldwide trends, showing decreases of 20 per cent for outflows and 37 per cent for inflows in 2008. The following year 2009 saw a further 59 per cent drop in outflows and 34 per cent in FDI inflows. The year 2010 saw a recovery of outward flows from the EU27 by 18 per cent but a further decrease of inward flows of 11 per cent (UNCTAD 2012). Obviously the crisis resulted in EU countries losing attractiveness for foreign investors, with their joint share in worldwide FDI inflows falling from an average 44 per cent over 2005–2007 to 27 per cent in 2010. The picture for the EU share in global FDI outflows between 2005–2007 and 2010 was broadly similar, decreasing from 56 per cent to 33 per cent (authors’ calculations based on UNCTAD 2012) – all of which suggests a relative loss of competitive and financial strength for EU-based investors. Notwithstanding these more recent adverse conditions, the likelihood remains that inward and outward FDI flows will have had a substantial impact on wages and working conditions in the EU member states.
Besides the ‘regular’ FDI flows, much larger financial flows circulate around the globe. For a large part these flows can be explained by the activities of Special-Purpose Entities (SPEs), defined by Eurostat as ‘a particular class of enterprise (often empty shells or holding companies) not included in all countries’ national statistics’ (website Eurostat FDI statistics). UNCTAD (2012, 7) notably regards Luxembourg and the Netherlands as typical home countries for SPEs – that is financial holding companies, although the national statistics of these countries, until recently at least, did not deliver data consistently on these streams. Coincidentally, the IMF Coordinated Direct Investment Survey (CDIS) has started to deliver information in this respect. These IMF statistics for 2011 reveal that both these flows (inward and outward) were 15 times as large as the ‘regular’ FDI flows linked with productive activities. In 2009–2011, the Netherlands (see Box 1.1), the US (in particular eight states, including Delaware) and Luxembourg, in that order, were the main destinations and sources of the total international financial flows (authors’ calculations based on IMF CDIS database and UNCTAD 2012). In these and other tax havens or offshore financial centres, financial ‘conduit’ structures managed by trust offices were instrumental for the avoidance of taxation in other countries, resulting in only a tiny fraction or no tax at all being paid in the country of settlement. It may be taken for granted that over 90 per cent of these largely indirect financial flows have no linkages whatsoever with the real economy of the countries involved (website Tax Justice Network; Wikipedia, Tax haven; Wikipedia, List of offshore financial centres5).
Box 1.1Special-Purpose Entities (SPEs) and the Dutch Tax Regime
There can be little doubt the SPE facilities that the Netherlands in particular offers are highly attractive for foreign companies. Facilitated by a special Dutch legal and corporate tax regime, the SPEs (in Dutch Bijzondere Financiële Instellingen, BFIs) have created a large network of tax treaties and tax rulings with (major) foreign companies in the Netherlands, which ensures such companies pay hardly any or no tax at all on their foreign profits, interest or royalties. The De Nederlandsche Bank (DNB; Dutch Central Bank) has identified three types of SPEs/BFIs: financing companies, that can be regarded as financial coordination centres of MNEs; (sub-)holding companies; and royalty companies, in particular set up by wealthy sports people and artists. Thus, SPEs are important links in settling the financial affairs of major MNEs and some very wealthy individuals. For example, over 80 of the world’s largest 100 firms own fiscal entities in the Netherlands. The list includes six of the ten very largest companies: Wal-Mart, Royal Dutch Shell, Exxon Mobil, BP, Toyota Motor and Chevron (Het Financieele Dagblad, 12/13 September 2011). In 2007 the DNB estimated that about 10,000 SPEs were registered in the Netherlands, though estimates of critical researchers went considerably higher (Van Dijk et al. 2006). Anyway, with remarkable prescience the Bank’s publication that included this estimate was titled ‘Special Financial Institution – integrity risks caused by large cash flows’ (DNB 2007). In 2006 the trust offices managing these activities had an estimated 16,000 international clients, who held about 20,000 local entities (Van den Berg et al. 2009) and a similar number of ‘mailbox companies’. In 2009 these amounts were slightly higher, leading researchers commissioned by the association of trust offices to conclude: ‘The trust industry appears to be quite crisis-proof: despite the slump in international trade, net entry and exit of clients and entities is low.’ However, they had to admit that between 2006 and 2009 the activities of the MNEs involved decreased (Risseeuw and Dosker 2011, 8, 17).
The financial flows linked with the Dutch SPEs are immense. For instance, if they were included in a country’s FDI statistics, then the Netherlands would, in 2009, have ranked first in the world, with inward FDI flows yearly amounting to about US$3,000 billion and outward flows of about US$3,700 billion – respectively 3.8 and 4.6 times the country’s gross national product (GNP).6 These amounts were proudly confirmed by both the DNB (2011) and Statistics Netherlands (CBS 2011, 62). The advantages for the Dutch economy mainly include local employment for financial and legal experts and related staff, estimated at about 3,500 jobs for 2009 (2006: 3,000), a relatively minor and decreasing amount of tax income for the Dutch government (estimated for 2009 at US$1.3 billion, for 2006 at US$1.6 billion), and possibly some spin-off to real investments in Dutch operations in the Netherlands (Van den Berg et al. 2009; Risseeuw and Dosker 2011).7 They may well be outweighed by the disadvantages, notably the ‘integrity risks’, which include attracting firms and persons with a doubtful reputation as well as tax revenue foregone by other countries. It has been pointed out that as a consequence of the tax regimes like that of the Netherlands, developing countries would fail to collect tax revenues which otherwise could have been used to finance health care, education and other essential public services. Based on mid-2000s data, such missing revenues in the Dutch case have been estimated at about US$870 million (Weyzig and Van Dijk 2007).
As indicated, the overall WIBAR-2 project included 13 EU member states. Within this grouping we analysed FDI data in relation to WageIndicator results for ten countries: Belgium, the Czech Republic, Finland, Germany, Hungary, the Netherlands, Poland, Spain, Sweden and the United Kingdom. We added FDI data for three more countries, namely, Denmark, France and Italy. The first ten countries alone attracted major amounts of foreign investment. For instance, between 2006 and 2010 they accounted for two-thirds (67%) of the total FDI inflow into EU countries (although this aggregate figure for the period masks a steady annual decline from 77% of the EU total in 2006 to 55% in 2010). FDI outflows from the ten countries were also considerable, accounting for 60 per cent of the EU27 total in the 2006 to 2010 period. The pattern here was for a steady annual increase of outflows between 2006 and 2008 with a sharp fall in 2009 and a pretty robust recovery in 2010 to finish close to the 2006 position (UNCTAD 2008, 2010, 2011a).
Since 1945 the UK, which was always the preferential destination for FDI notably from the US, and had in the 1990s witnessed the largest FDI inflows among the EU countries (Ferner 2003, 83), also received the single largest amount of inward FDI over the period 2006 to 2010 (US$461 billion, amounting to some 30% of the EU total). It was followed by Belgium (US$379 billion), Germany (US$221 billion), Spain (US$206 billion) and the Netherlands (US$155 billion).8 Over the same years, Germany with US$582 billion was on top of the list of ‘our’ ten countries insofar as outward FDI flows were concerned. The UK (US$570 billion) ranked second, followed by the Netherlands (US$305 billion), Belgium (US$293 billion) and Spain (US$284 billion).9 The result was a net FDI deficit in 2006–2010 for these countries except for Belgium. Both Scandinavian countries included in the project also showed FDI deficits: Sweden with cumulative inflows of US$109 billion and outflows of US$150 billion and Finland in these five years with US$23 billion in foreign investment entering the country and US$33 billion invested abroad (authors’ calculations based on UNCTAD 2011a).
In the past two decades, the administrations of the Czech Republic, Hungary and Poland, who are the three Central and East European Countries (CEECs) included in our project, have all actively encouraged and promoted FDI, as part of their programmes of economic liberalization and privatization. These governments introduced a wide range of incentives for foreign (and domestic) investors. The first two countries saw fluctuating FDI inflows over 2006–2010, totalling US$33 billion (Czech Republic) and US$23 billion (Hungary). By contrast the inflow in Poland over the same period amounted to US$81 billion. Though modest by international comparison, FDI inflows in these three countries have induced fundamental shifts in their economic structures. For example, in some sectors investment by western MNEs has pushed domestic competitors out of the market (cf. Hunya and Galgóczi 2006, 535–6). This effect may help explain why the outward FDI of Czech, Hungarian and Polish firms has so far remained relatively low, amounting to US$10, 15 and 29 billion respectively over 2006–2010 (all data: authors’ calculations based on UNCTAD 2011a). As we show in Chapter 2, in the other ten countries scrutinized, the numbers employed by firms based in these three countries were similarly small.
We now shift our focus from FDI flows to FDI stocks. Table 1.1 presents an overview of the FDI inward stock and the GDPs of the ten countries we primarily studied, adding information for Denmark, France and Italy. Over the last decades the United Kingdom has plainly been attractive for multinational investors and, by 2010, had the largest stock of foreign investment, followed by France, Germany, Belgium, Spain and the Netherlands. The picture changes if population size is taken into account; Belgium with per capita inward FDI stock of over US$60,000 was by far the largest, with Sweden and the Netherlands next in line on this measure. They were followed by the UK and Spain with Poland ranked last. Taken together the per capita FDI stock in the ten countries was over 30 per cent higher than the average for Denmark, France and Italy. It was also over one-quarter higher than the average for the remaining 14 EU member states.
Table 1.1FDI inward stock and GDP, in total and per capita; FDI in percentages of GDP, 2010; number of employed in foreign-owned MNEs and in percentages of total private employment,* 2008, by country
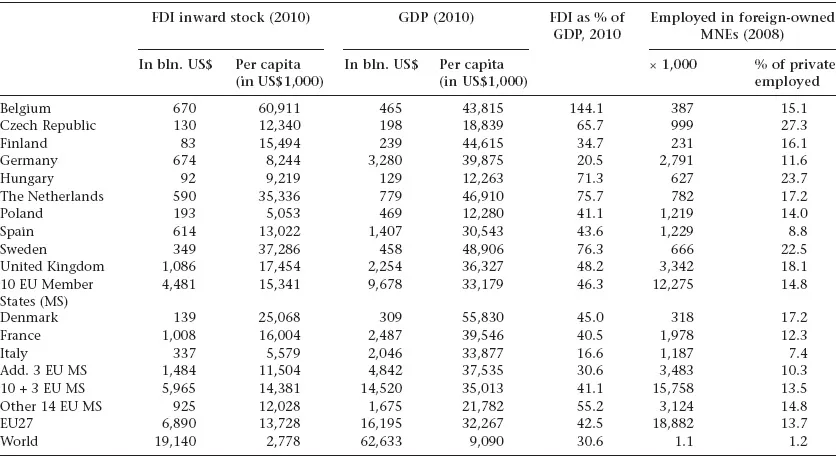
*Excluding finance.
Source: Authors’ calculations based on United Nations Statistical Database; UNCTAD, 2011; Eurostat, FATS statistics, Annual enterprise statistics.
The country picture changes only slightly if we relate the FDI stock to respective GDPs. Belgium is plainly in a league of its own, the value of its inward FDI being over 40 per cent higher than the country’s GDP.10 Elsewhere for Sweden and the Netherlands the FDI stock was about three-quarters of their GDP; Hungary and the Czech Republic followed suit, but for the UK, Spain, Poland and Finland the relative importance of FDI was much lower, ranging between 35 and 48 per cent of their respective GDPs, which was closer to the EU27 average of 43 per cent. This was also the case for Denmark and France. Germany was low in this ranking with an inward FDI stock equivalent to 21 per cent of its GDP, though in this respect surpassed by Italy with 17 per cent. It is noteworthy that a considerable part of the FDI flows to EU countries comprise flows between these countries. Thus, in 2010, 58 per cent of the total FDI inward stock of the EU27 countries resulted from intra-EU capital flows. For some EU member states this share was even higher. For instance, the share of EU countries in the inward FDI stock of the Netherlands was 65 per cent, and in the three CEECs involved, it was over 80 per cent (authors’ calculations based on Eurostat FATS and FDI statistics).
In its two most right-hand columns, Table 1.1 details private employment levels related to FDI in the EU27 and in the ten countries studied. FDI-related employment here is defined as those working in affiliates of foreign-owned MNEs. According to the Eurostat statistics in 2008, excluding finance, it concerned nearly 18.9 million employees of which over 12.2 million or 65 per cent were to be found in the ten countries, and nearly 3.5 million or 18 per cent in Denmark, France and Italy. By 2008, the privately employed workforce, again excluding finance, of the ten countries in total amounted to 83 million, giving a 14.8 per cent share of that total employed in foreign MNEs. For the other three countries the equivalent share amounted to 34 million (13.5%). This share for the EU27 was a fraction higher at 13.7 per cent. The table also depicts the range of impact FDI had on employment levels across countries. Three countries, the Czech Republic, Hungary and Sweden, clearly were in the lead here with 22 to 27 per cent of their respective workforces privately employed in foreign MNEs. By 2008, the UK could be found on top of a middle grouping,11 accompanied by Belgium (showing a relatively low FDI employment share compared to its FDI stock), Finland, the Netherlands, Poland and Denmark, with foreign MNEs accounting for 14 to 18 per cent of private employment, whereas France, Germany (both around 12%), Spain (9%) and Italy (7%) all showed lower shares. It may be added that in terms of employment the EU27 also felt the fall in FDI inflows, as Eurostat data show a decrease of about 1.2 million jobs in foreign-owned MNEs in 2009 compared to 2008.
Table 1.1 provides a preliminary impression of the openness of national economies, delineating the importance of both FDI and the ‘footprint’ of MNEs in the respective countries we studied. With this book we hope to present a different view of the impact of MNEs from the usual presentations which have tended to focus on the value of FDI stocks. Other indications of MNE activity in a country, in particular employment levels in foreign affiliates, in our view, need to be incorporated. In Chapters 3 to 7 we detail FDI-related employment by country and industry.
After providing this basic context to help situate ‘our’ countries in the FDI and globalization spectrum, we start this chapter by outlining the various forms, motives and approaches of the expansion of MNEs. These may well have differing effects on the labour market position and wages of various categories of workers. Second, we summarize the recent literature on wage differentials between MNE subsidiaries and domestic firms (‘non-MNEs’). We relate this to the debate on the causality of the differences between MNEs and other firms in terms of productivity, technolog...
Table of contents
- Cover
- Title
- Copyright
- Contents
- List of Boxes, Figures and Tables
- Preface and Acknowledgement
- 1 The Wage and Employment Effects of Foreign Direct Investment
- 2 The AIAS MNE Database and the WageIndicator Survey
- 3 Metal and Electronics Manufacturing
- 4 The Retail Industry
- 5 Finance and Call Centres
- 6 Information and Communication Technology (ICT)
- 7 Transport and Telecom
- 8 A Comparative Analysis
- Statistical Appendix
- Technical Appendix
- Notes
- References
- Index
Frequently asked questions
Yes, you can cancel anytime from the Subscription tab in your account settings on the Perlego website. Your subscription will stay active until the end of your current billing period. Learn how to cancel your subscription
No, books cannot be downloaded as external files, such as PDFs, for use outside of Perlego. However, you can download books within the Perlego app for offline reading on mobile or tablet. Learn how to download books offline
Perlego offers two plans: Essential and Complete
- Essential is ideal for learners and professionals who enjoy exploring a wide range of subjects. Access the Essential Library with 800,000+ trusted titles and best-sellers across business, personal growth, and the humanities. Includes unlimited reading time and Standard Read Aloud voice.
- Complete: Perfect for advanced learners and researchers needing full, unrestricted access. Unlock 1.5M+ books across hundreds of subjects, including academic and specialized titles. The Complete Plan also includes advanced features like Premium Read Aloud and Research Assistant.
We are an online textbook subscription service, where you can get access to an entire online library for less than the price of a single book per month. With over 1.5 million books across 990+ topics, we’ve got you covered! Learn about our mission
Look out for the read-aloud symbol on your next book to see if you can listen to it. The read-aloud tool reads text aloud for you, highlighting the text as it is being read. You can pause it, speed it up and slow it down. Learn more about Read Aloud
Yes! You can use the Perlego app on both iOS and Android devices to read anytime, anywhere — even offline. Perfect for commutes or when you’re on the go.
Please note we cannot support devices running on iOS 13 and Android 7 or earlier. Learn more about using the app
Please note we cannot support devices running on iOS 13 and Android 7 or earlier. Learn more about using the app
Yes, you can access Multinational Companies and Domestic Firms in Europe by K. Tijdens,D. Gregory,Kenneth A. Loparo,Maarten van Klaveren in PDF and/or ePUB format, as well as other popular books in Business & Business General. We have over 1.5 million books available in our catalogue for you to explore.