With contributions from international scholars, this second volume by Joseph Stiglitz and Martin Guzman comprises of theoretical, empirical, and policy-based chapters which carefully utilize theory and data analysis.
Part I focuses on the issues of global inequality, poverty measurement and security. Part II turns to the issue of income contingent loans (ICL), where the repayment in any year depends on the annual income of the individual. These loans have proven to be an especially effective way of financing higher education, but there has been experimentation of the use of these loans in several other areas.

eBook - ePub
Contemporary Issues in Microeconomics
- English
- ePUB (mobile friendly)
- Available on iOS & Android
eBook - ePub
Contemporary Issues in Microeconomics
About this book
Trusted by 375,005 students
Access to over 1.5 million titles for a fair monthly price.
Study more efficiently using our study tools.
Information
Part I
Inequality, Poverty, and Security
1
The University of Texas Inequality Project Global Inequality Data Sets, 1963–2008: Updates, Revisions and Quality Checks
James K. Galbraith, Béatrice Halbach, Aleksandra Malinowska, Amin Shams and Wenjie Zhang
University of Texas Austin
1.1 Introduction
The UTIP-UNIDO data set of industrial pay inequality is a panel comprised of the between-groups component of Theil’s T statistic measured in different countries and years across a stable and consistent set of industrial sectors. The Theil method is described in full elsewhere (Conceição, Ferreira and Galbraith 1999). Initially computed by Galbraith, Lu and Darity (1999) and updated by Galbraith and Kum (2004), the UTIP-UNIDO data set has the virtue of providing dense, consistent, accurate measures, and it has the limitation of being restricted to the inequality of inter-industrial pay. Its principal direct interest for economists is the study of common trends and of common factors affecting inequality, such as interest rates, debt crises, changing financial regimes, technology and trade. It has also proved to be a sensitive measure of major political events. Perhaps most important, the UTIP-UNIDO measures prove to be an effective instrument for estimating Gini coefficients for gross household income inequality, and this permits the construction of a dense and consistent panel of such estimates, complementing and extending the direct measurements available from other sources.
1.2 Updating UTIP-UNIDO
Updating UTIP-UNIDO was more difficult than computing it originally, as maintenance of the underlying set (UNIDO’s Industrial Statistics) has been uneven and categories have not always remained stable. The resulting anomalies in the new Theil measures were of two types: spikes due to missing values and wholesale shifts (data breaks) due to category changes. Each had to be evaluated separately, and adjustments made – a daunting task considering that behind each Theil value lies some 30 separate measures each of payroll and employment. These issues were handled on a case-by-case basis, using judgment and common sense to arrive at a set of “final revised values.” The end result was a data set with 4,054 country-year Theil values over, up from 3,554 in the previous version.
Table 1.1 Revised coefficient estimates relating UTIP-UNIDO to Deininger–Squire
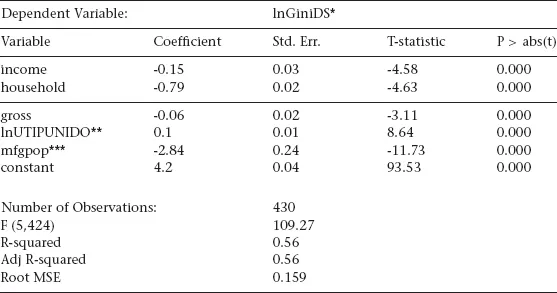
*natural log of Deininger-Squire Gini Coefficient
**natural log of UTIP-UNIDO Theil statistic
***ratio of manufacturing employment to population
Source: Authors.
1.3 Updating EHII
The calculation of EHII from UTIP-UNIDO was based on a regression of overlapping observations on the original Deininger–Squire data set of Gini coefficients, published by the World Bank around 1996. The regression controlled for the share of manufacturing in total population, and for the type of measure involved – whether gross or net of taxes, household or personal income, and whether a measure of income or expenditure – in the Deininger–Squire (DS) data set. Originally, 454 common country-year observations were found. The proliferation of Gini-type inequality measures in later years posed a challenge, but we decided to compute the new EHII so as to most closely resemble the previous version, this time using 430 common observations. The coefficient estimates are given in Table 1.1. They are very close to the originals.
EHII is then calculated using the coefficient estimates for the log of the UTIP-UNIDO measures (lnUTIP-UNIDO) and the manufacturing/population ratio (mfgpop), standardizing all coefficients on the concept of gross household income inequality. This estimates the effect of all cash inflows (including, for example, pensions) but not the effect of taxes.1 The purpose of EHII is comparative. It is, above all, to populate a panel data set with as many conceptually consistent inequality measures as available data would reasonably allow. The new EHII panel has 3,871 estimates for 149 countries.
1.4 Checking the quality of the estimates
The next issue is the quality of the estimates. This is a question we had not previously addressed, beyond reporting the regression residuals that separated our EHII estimates from the corresponding DS values. That procedure had provided only the most limited comparison, since there were (and are) nearly ten times as many EHII observations as there are overlapping EHII-DS values. We felt it would be useful to attempt to place the EHII estimates in the context of the broader literature on economic inequality.
The difficulty in going beyond those first comparisons with DS was: what inequality measurements to pick? Our solution was to undertake a wide (if not comprehensive) literature search for Gini coefficients of all types for a sequence of countries, including some that are very well-studied, and others less so. Each coefficient was tagged by the country and year to which it applied, by its source document, and by the precise description of the type of inequality being measured. These types were then classed into three major groups by greyscale. Black represented measures of “market income inequality.” Dark grey represented measures of gross income inequality, which would (in general) include pensions and other forms of cash income. Light grey represented measures of inequalities of disposable income, after transfers and taxes.2 We used solid lines to represent measures of the household distribution, and dotted lines to represent measures of the personal distribution. Dense measures (annual or nearly so) are represented by continuous lines; measures with only sparse representation over time are represented by isolated markers. Against these measures taken from the literature, we plot the EHII estimate for gross household income inequality in a thick black line.
Figures A1.1 through A1.15 in the first appendix represent a selection of developed and developing countries.3 The first, striking fact is the wide range of inequality measurements in this data, even for developed countries. In a typical, well-studied case for a small, seemingly homogeneous country, Denmark has a market income inequality estimated to be near 45 Gini points, and disposable income inequality measured at some 25 Gini points lower than that. Similar disparities appear for all of the other advanced social democracies, including Germany, France and Canada, and for the United Kingdom and the United States.
A casual narrative has sprung up around these numbers, to the effect that the most advanced countries have very unequal “primary” distributions, offset by a great deal of redistribution. But this is not correct. The UTIP-UNIDO series, which measure the inequalities of pay, show the Nordic and North European cases to be among the world’s most egalitarian in their primary structures. On short reflection, though, the paradox disappears. Very high inequalities in “market income” in countries with advanced welfare states must stem from the existence of many households with zero market income – and no need for it. Household formation is endogenous to the social structure and available sources of income. In countries with strong public pensions, it is possible for many elderly couples and for single adults of all ages to form households on non-market income. One has to suppose that, in many cases, this is exactly what they do. Such households will be far more scarce in countries where market income is necessary for life.
Data for two distinct additional groups of countries appear to support this interpretation. For Russia, Poland, Hungary and the Czech Republic, we have inequality measures which show a narrower, yet still distinct, difference between “market-income inequality” and disposable-income inequality. We also have a class of inequality measures based on consumption surveys. A virtue of the EHII measure is that – being based on a data set of industrial pay inequality that is neither income nor consumption and that can be calculated across regions (Europe, the Americas) that have predominantly income-based surveys as well as regions (South Asia, Africa) where surveys are predominantly consumption-based – EHII provides a bridge that permits reasonable calibration of these two very different types of survey.
For the transition countries, a plausible interpretation of the evidence is that the post-communist countries do not have welfare states as developed as those in Northern Europe. On the other hand, they also do not have the inequalities of pay associated with Latin America, Sub-Saharan Africa, and other parts of what used to be called the Third World. Having said this much, it also seems clear that some reported measures or estimates of market income inequality are too variable and too erratic to be taken very seriously as indications of changing economic conditions.
Once outside the familiar data environments of the long-industrialized countries, matters become murkier, in part because there are fewer independent sources of information. For Mexico, for instance, all inequality measures apart from EHII stem from a single source, the Institute of Statistics, Geography and Informatics (INEGI) survey of household incomes. There exists a wide range of inequality measures for Mexico, but evidently they all merely reflect sampling, definition and computational choices made on the same underlying data set. A similar situation holds for Brazil. We also found that in many cases it was not possible for us to distinguish clearly from the source articles4 whether the income concept was gross or net. It is, nevertheless, significant that for these countries there is no distinct difference between market, gross and disposable income inequality measures on average. The numbers reported in the published literature are an overlapping and indistinct jumble. We take this as general support for the view that both market and disposable income inequalities are determined, in part, by the social structures of the welfare state.
In almost all cases, the movement of the EHII estimates track the historical pattern observed in other series reasonably well, which suggests – unsurprisingly – that changing inter-industrial pay dispersion has a strong effect on household income differentials. For a wide range of wealthy-country cases, the level of the EHII estimates come in where we would have hoped: below the estimates of “market income inequality,” above the measures of disposable income inequality, and close to the (relatively few in number) direct measures of gross income inequality. We take both of these findings to be broad validation of the simple model used to estimate EHII, though three classes of exception will be noted below. The purpose of the EHII exercise was to take advantage of the dense and consistent measures of industrial pay inequality in UTIP-UNIDO to construct a panel of conceptually-consistent measures in a Gini coefficient format. Judging against the broad literature of inequality measures, EHII appears to be well-suited to this purpose.
A first important exception is the case of the United States. In the US, where both sample surveys and tax records abound and are widely considered to be reasonably accurate, EHII misses the great peaks of inequality that appeared in the late 1990s and in the years before the great financial debacle of 2007. There is no mystery as to the reason. Top incomes in the US are driven by capital asset prices, either in the form of realized capital gains, stock options realizations, financial commissions, or the wage/salary payout of venture capital investments in high-technology firms. These fluctuate closely with the movement of the stock market. EHII, on the other han...
Table of contents
- Cover
- Title
- Copyright
- Contents
- List of Figures
- List of Tables
- Foreword
- Notes on Contributors
- Introduction
- Part I Inequality, Poverty, and Security
- Part II Income Contingent and Student Loans
- Index
Frequently asked questions
Yes, you can cancel anytime from the Subscription tab in your account settings on the Perlego website. Your subscription will stay active until the end of your current billing period. Learn how to cancel your subscription
No, books cannot be downloaded as external files, such as PDFs, for use outside of Perlego. However, you can download books within the Perlego app for offline reading on mobile or tablet. Learn how to download books offline
Perlego offers two plans: Essential and Complete
- Essential is ideal for learners and professionals who enjoy exploring a wide range of subjects. Access the Essential Library with 800,000+ trusted titles and best-sellers across business, personal growth, and the humanities. Includes unlimited reading time and Standard Read Aloud voice.
- Complete: Perfect for advanced learners and researchers needing full, unrestricted access. Unlock 1.5M+ books across hundreds of subjects, including academic and specialized titles. The Complete Plan also includes advanced features like Premium Read Aloud and Research Assistant.
We are an online textbook subscription service, where you can get access to an entire online library for less than the price of a single book per month. With over 1.5 million books across 990+ topics, we’ve got you covered! Learn about our mission
Look out for the read-aloud symbol on your next book to see if you can listen to it. The read-aloud tool reads text aloud for you, highlighting the text as it is being read. You can pause it, speed it up and slow it down. Learn more about Read Aloud
Yes! You can use the Perlego app on both iOS and Android devices to read anytime, anywhere — even offline. Perfect for commutes or when you’re on the go.
Please note we cannot support devices running on iOS 13 and Android 7 or earlier. Learn more about using the app
Please note we cannot support devices running on iOS 13 and Android 7 or earlier. Learn more about using the app
Yes, you can access Contemporary Issues in Microeconomics by Joseph E. Stiglitz, Joseph E. Stiglitz,Kenneth A. Loparo,Martin Guzman, Joseph E. Stiglitz, Martin Guzman in PDF and/or ePUB format, as well as other popular books in Economics & International Business. We have over 1.5 million books available in our catalogue for you to explore.