This valuable book provides a much-needed integration of fundamental analysis of global forces and technical analysis to provide highly probable trades in currency markets.
Fundamental analysis is often too vague and not quantified. This book provides insights into fundamental analysis and then calibrates it to trading strategies and techniques. Fundamentals are clearly defined as longer-term economic expectations regarding growth, inflation, and labor conditions. Nearer-term understanding of fundamentals deals with market psychology, where markets are manifest risk-on and risk-off emotions. Currencies are explained as expectations battles generating expectation waves.
With real trading examples included to underscore the concepts, Planet Forex gives readers an invaluable primer on trading market sentiment that is unprecedented. This book is a must-read for global forex traders, portfolio managers, and other employees in the forex industry, including exchanges, brokerage firms, and financial planners and advisors.
Trusted by 375,005 students
Access to over 1.5 million titles for a fair monthly price.
Fundamental analysis, or a fundamental view of currency markets, is widely misunderstood. It is not simply about the economic conditions facing a country. Fundamental analysis, when properly understood, contains sentiment analysis. Let us state this another way. Fundamental analysis deals with economic forecasts and expectations about economic metrics such as CPI (consumer price index), GDP (gross domestic product), employment, and so on. These fundamental expectations involve longer- and medium-term durations. The exact mix of expectation durations is, in fact, always changing. Sometimes expectations of economic outcomes a year ahead may impact current price action. At other times, the immediate geopolitical and global economic conditions have an immediate impact.
In a way, this view of a fundamental structure behind currency movements is similar to recent discoveries in physics of the Higgs boson field. In that major discovery, it has been proven that electrons get their mass as they go through the Higgs boson field. In currency trading we can say that prices get their direction and strength of direction as they go through a field filled with fundamental expectation forces. Sentiment is the bridge and transmission channel, between long-term and short-term economic expectations that directly act upon the price.
Within the rubric of fundamental analysis, sentiment analysis focuses on current expectations about whether prior fundamental forecasts are correct. In other words, sentiment is the measure of the immediate change in expectations, caused by data releases, geopolitical crises, or any other information shock that reaches the markets. Sentiment is about both long-term and short-term expectations. Sentiment is how the market expresses emotions. Emotions are always about something and in currency markets emotions are generally about risk and uncertainty. Traders, therefore, need to diagnose what the market movements are about. This contrasts greatly with the current, dominant technical view of markets and currency pairs.
What is a Currency Pair Price? A Fundamental View
An exclusive technical analysis view of markets, and in particular currency pairs, is highly flawed. The weaknesses and limits of technical analysis starts with a misunderstanding of what currency prices are all about. The currency pair is, from a technical analysis view of market reality, a point on the X–Y price axis. Charts visualize the price behavior. For example, if the EURUSD has moved 20 pips, from 1.1700 to 1.1720, a line chart will show how this movement has occurred. Candlestick charts show open, high, low, and close prices per unit of time (minute, hour, or other time slices). The X axis represents time. Simple enough. But is that what a price really is? The fact is that it is more than a measure on a X–Y axis.
The fundamental viewpoint asserts that a currency price and its accompanying charts, are codes that are really enciphered signatures of expectations. A better understanding of how to unlock the codes within each currency pair will enable traders to profitably ride the expectation waves that move currency prices.
Flaws in Technical Analysis
The question arises: If technical analysis has these flaws, why is it so dominant? The answer is rather simple. The dominance of technical analysis as a tool for traders is not because technical analysis is totally effective, but because it is easy to sell systems and courses offering hyperbolic performance promises. It is natural that traders want to find the holy grail for predicting direction. As a result, responding to the desires and hopes of traders, there is extensive marketing of signals and systems, and courses that teach set-ups to respond to this demand. Some systems and signals are profitable. None are profitable all of the time. The products of the trading industry are designed to be produced with minimal viability, because speed to the market is a more important priority than performance effectiveness. As a result, a total reliance on technical set-ups presents many flaws. Let us explore further some of the deep flaws in using technical analysis.
The first deep flaw in exclusive reliance on technical analysis is psychological and philosophical. The very premise that one can predict that a price will reach a target is fraught with problems. The price target is in reality not technical in nature. It is a fabricated human construction. It is as subjective as searching for and finding a face in the clouds. If you look for one you will find it, but it is delusional to believe that the face in the clouds really exists. Similarly, a profit target is a point of hope in the price arena. But in trading, “hopium” is not a useful drug.
The very act of thinking that there is a target inherent in the currency pair price or pattern is also teleological (defined as inferring something has an intention). Inferring intention is a common attribute of human behavior because it is more comforting to deal with an assumed intention then to deal with uncertainty. Consider the following statements: “The price wants to go to the next Fibonacci level”. “The price will bounce off resistance and then move to support”. “The price will break the outer trend line and then move to the inner trend line.” These types of comments are heard every day by traders and reflect the flaw that is inherent in teleological thinking in trading.
Sidebar
Definition of teleology:
(a)
the study of evidences of design in nature;
(b)
a doctrine (as in vitalism) that ends are immanent in nature;
(c)
a doctrine explaining phenomena by final causes.
(September 11, 2017; Teleology | Definition of Teleology by Merriam-Webster; https://www.merriam-webster.com/dictionary/teleology)
The fact is that a price does not know where it wants to go, because the price is really an instant in time of a balance between bullish and bearish expectations. A target also has the effect of suppressing profitability. Many traders who put on a trade that reaches a target price often take profit at that target, only to learn that the profits would have been higher. Technical profit targets are best used as guides only.
A second powerful source of error and weakness in trading analysis is the use and analysis of trend lines. An uptrend is technically defined as when a price has a higher high and a higher low. A downtrend, conversely is defined as when a price has a lower high and a lower low. A popular saying is: “the trend is your friend.” Going with the trend seems like a good approach. But keep in mind that the trend is your friend until it is at an end. Trend analysis offers a great deal of ambiguity in detecting a shift in the trend. When is it really over? Is it at a break of a line? How thick is the line? Is it 10 pips? This difficulty of defining a break in the trend applies to both intraday and longer durations.Central banks have a very hard time pinpointing just when a break in inflation trends is occurring. That is why they notoriously act too late and allow inflation to go too far, or too early, and put breaks on growth, stimulating a recession. Precision of projecting where prices are going is a common challenge to both traders and policy markets.
Of course, lines do not exist and are just heuristic devices, which is a method to get a sense of the boundaries of price action. Lines are mathematical inventions to overlay on what we see. At best, a trend is a map of a path of prices. It leaves a great deal of room for error. It is a very low-resolution map.
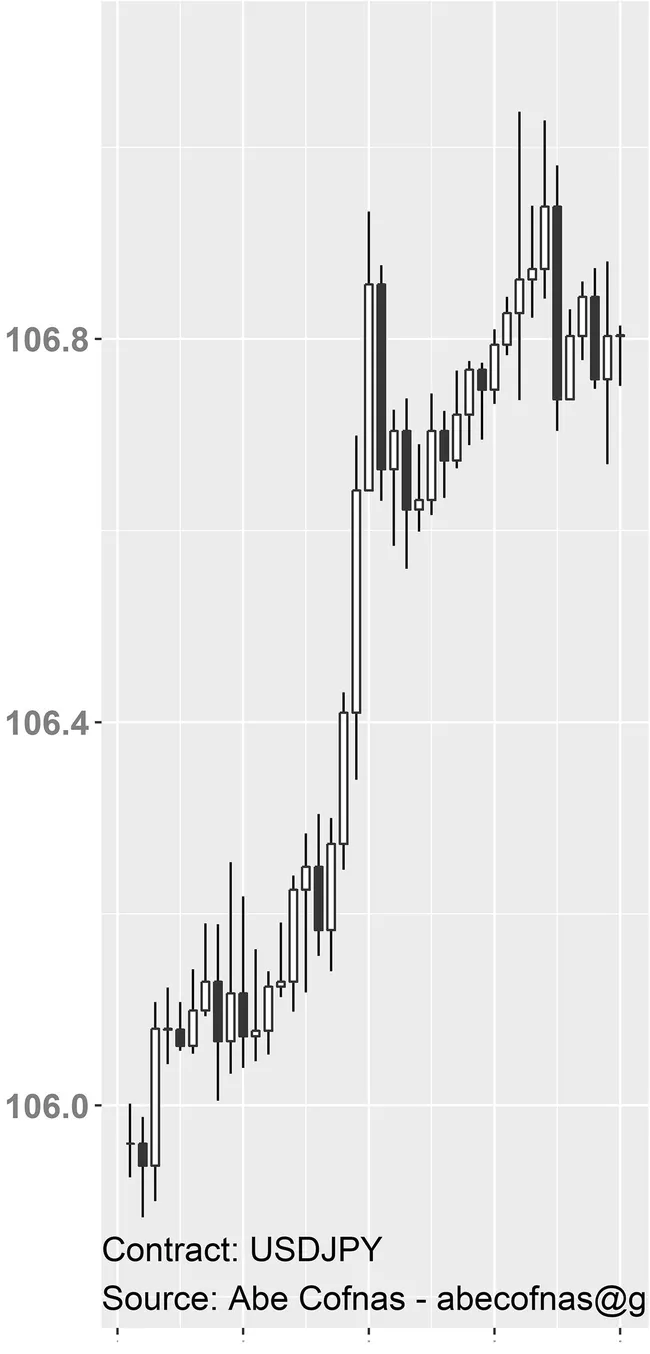
Resistance and Support Lines
The concepts of resistance and support are part of the foundations of technical analysis. Like trend lines, resistance and support convey assumptions about price patterns that are ambiguous. Just when is resistance or support broken? When is resistance and support simply being probed? Current technical analysis of resistance and support treat those concepts as firm and quantifiable. They are not. We can see the inherent ambiguity in finding resistance and support (Chart 1.1).
Chart 1.1
Resistance and support is hard to locate
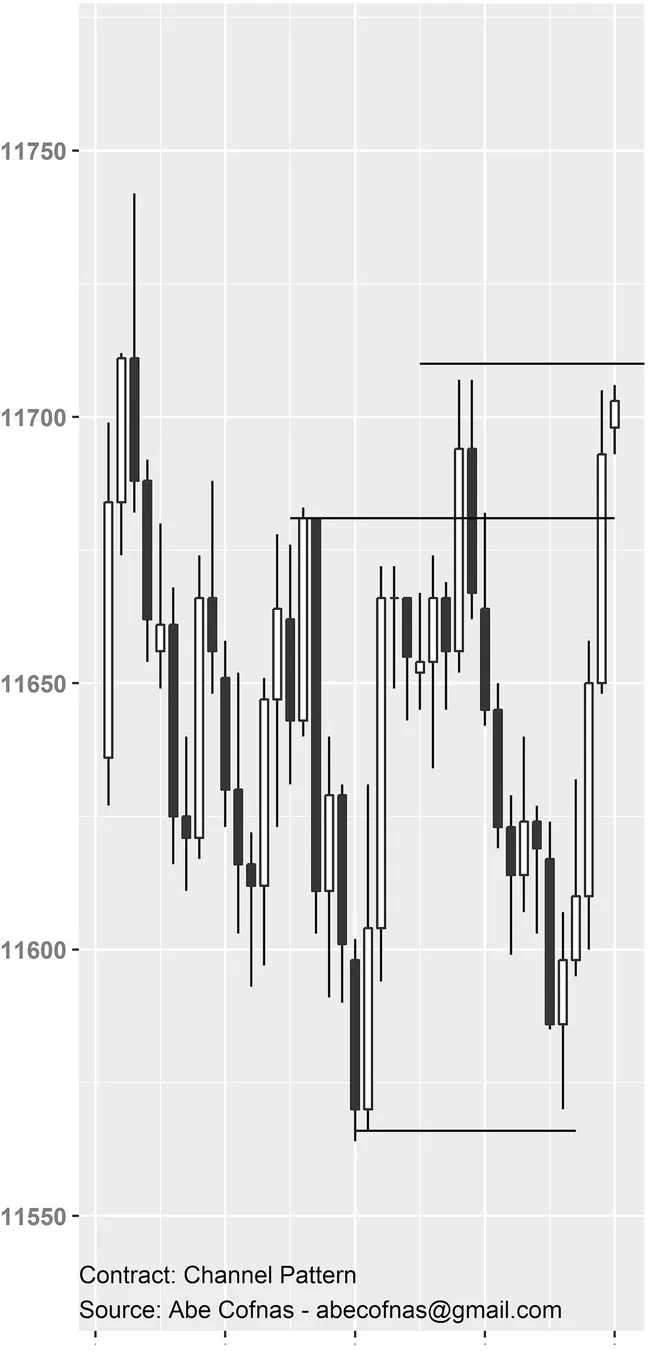
Price patterns such as triangles and channels are patterns that exhibit similar degrees of vagueness and are imprecise when the trader attributes powers to the patterns that they do not have to predict future price direction (Chart 1.2).
Chart 1.2
Triangles, and channels
Keep in mind that the patterns, which are perceived by traders, are subjective and at best ex-post facto. They are easy to see after they have formed. True patterns in nature are mathematical and can be tested by scientific methods. More importantly, they are intersubjective, which means that other people can confirm them. Price patterns are flawed because they are best-case interpretations. However, patterns do provide evidence of the status of emotions in the market.
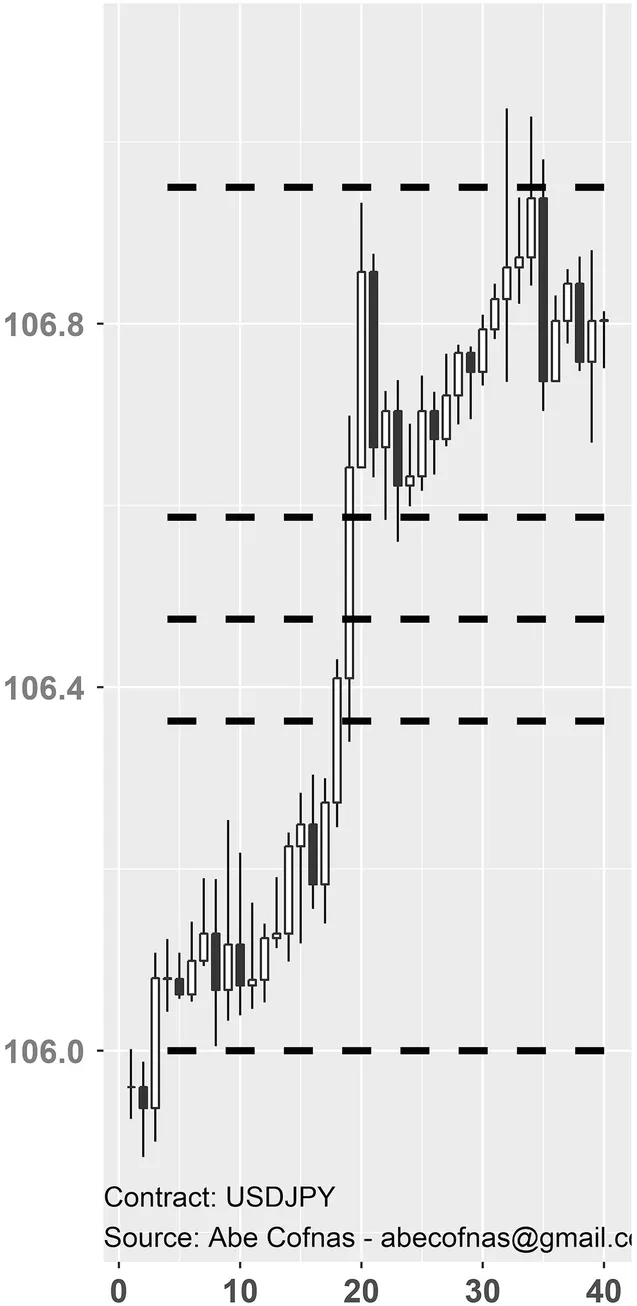
Fibonacci levels are among the most popular tools for trading and do give insight into the nature of price action. Although the field of technical analysis ascribes nearly magical powers to Fibonacci levels, they are still not reflective of any inherent direction. When prices seem to move in Fibonacci retracement ratios it is because that is the way energy moves everywhere (the famous Nautilus shell is a classic illustration of Fibonacci patterns, and the proportions of the human face follow Fibonacci ratios), but this does not mean that they predict where the price is going. Furthermore, markets recognize where the Fibonacci points are and use them to create trading triggers. This creates a self-fulfilling process. Fib lines need to be seen as providing zones of possible resistance and support. The most important weakness in applying Fibonacci analysis relates to the confusion of where to locate a bounce or break off a fib line. This kind of thinking creates a lot of room for error. Just when can a break of a Fibonacci line be considered a break? A break is a very subjective concept. Do we consider a break when the price reaches above or below a Fib line? Or do we have to wait for a candle to close more than once above such a line? The answer may vary among different traders (Chart 1.3).
Chart 1.3
Vague bounce and breaks around Fibonacci levels
Chart wave analysis (Elliott Wave) is another popular form of technical/teleological analysis that offers traders the promise of finding and riding a direction more accurately. The problem with wave analysis is that it is not falsifiable. Prices are defined as being in waves that are part of an impulse or a corrective sequence. Within each sequence there are mini waves as well. Those who follow wave analysis find comfort in this detailed set-up, until prices do not follow the wave prediction. Rather than accepting the fact of being wrong, wave analysts will say that the price is correcting and then will resume back in the right direction. Many traders have heard the statement: the price will go down and then go up. This is nonsense. It is subjective and vague. It is misleading to the trader who wants to use a method that is reliable. When is a wave based trade wrong? Wave trading is a form of forecasting that has huge degrees of ambiguity. Riding the wave is easy when one is looking in the rear-view mirror.
The body of technical analysis also includes popular tools such as indicators and moving averages. They have a major weakness in common: they are lagging indicators. The mathematics of their construction calculates past prices and transforms them using a variety of equations into an indicator number. They should be seen as training wheels for the new trader. As the trader gets more experienced, these wheels are taken off and the trader focuses on the price action itself. Instead, bad habits are hard to change and traders find themselves loading a chart with so many indicators that it looks like a J...
Table of contents
Cover
Front Matter
1. What is Fundamental Analysis?
2. Core Fundamental Forces and How to Monitor Them
3. Understanding Central Banks and their Role in Moving Currency Markets
4. How to Decode Central Bank Statements
5. What is Sentiment?
6. Sentiment Trading Set-Ups
7. Cryptocurrencies
8. The Future of Forex Trading: Algorithms, Artificial Intelligence, and Social Forex Trading
Back Matter
Frequently asked questions
Yes, you can cancel anytime from the Subscription tab in your account settings on the Perlego website. Your subscription will stay active until the end of your current billing period. Learn how to cancel your subscription
No, books cannot be downloaded as external files, such as PDFs, for use outside of Perlego. However, you can download books within the Perlego app for offline reading on mobile or tablet. Learn how to download books offline
Perlego offers two plans: Essential and Complete
Essential is ideal for learners and professionals who enjoy exploring a wide range of subjects. Access the Essential Library with 800,000+ trusted titles and best-sellers across business, personal growth, and the humanities. Includes unlimited reading time and Standard Read Aloud voice.
Complete: Perfect for advanced learners and researchers needing full, unrestricted access. Unlock 1.5M+ books across hundreds of subjects, including academic and specialized titles. The Complete Plan also includes advanced features like Premium Read Aloud and Research Assistant.
Both plans are available with monthly, semester, or annual billing cycles.
We are an online textbook subscription service, where you can get access to an entire online library for less than the price of a single book per month. With over 1.5 million books across 990+ topics, we’ve got you covered! Learn about our mission
Look out for the read-aloud symbol on your next book to see if you can listen to it. The read-aloud tool reads text aloud for you, highlighting the text as it is being read. You can pause it, speed it up and slow it down. Learn more about Read Aloud
Yes! You can use the Perlego app on both iOS and Android devices to read anytime, anywhere — even offline. Perfect for commutes or when you’re on the go. Please note we cannot support devices running on iOS 13 and Android 7 or earlier. Learn more about using the app
Yes, you can access Planet Forex by Abe Cofnas in PDF and/or ePUB format, as well as other popular books in Business & Finance. We have over 1.5 million books available in our catalogue for you to explore.