Functional Aesthetics for Data Visualization
eBook - ePub

Functional Aesthetics for Data Visualization

  1. English
  2. ePUB (mobile friendly)
  3. Available on iOS & Android
eBook - ePub

Functional Aesthetics for Data Visualization

About this book

What happens when a researcher and a practitioner spend hours crammed in a Fiat discussing data visualization? Beyond creating beautiful charts, they found greater richness in the craft as an integrated whole.

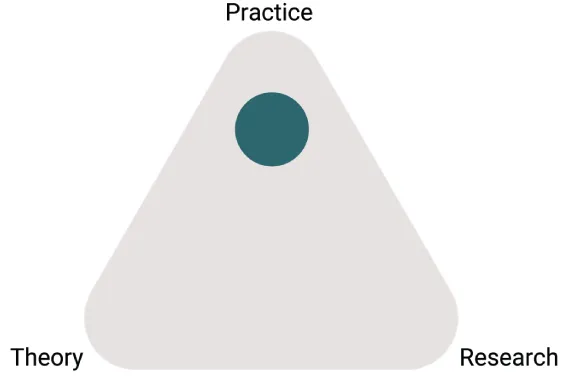
Drawing from their unconventional backgrounds, these two women take readers through a journey around perception, semantics, and intent as the triad that influences visualization. This visually engaging book blends ideas from theory, academia, and practice to craft beautiful, yet meaningful visualizations and dashboards.

How do you take your visualization skills to the next level? The book is perfect for analysts, research and data scientists, journalists, and business professionals. Functional Aesthetics for Data Visualization is also an indispensable resource for just about anyone curious about seeing and understanding data. Think of it as a coffee book for the data geek in you.

https://www.functionalaestheticsbook.com

Tools to learn more effectively

Saving Books

Saving Books

Keyword Search

Keyword Search

Annotating Text

Annotating Text

Listen to it instead

Listen to it instead

Information

Photo depicts Yosemite Valley
Conversation over a campfire
Hritik/Adobe Stock

PART B
Semantics

Journalist Flora Lewis once wrote,
Learning another language is not only learning different words for the same things, but learning another way to think about things.
In the late 1970s, Nicaragua established its first Deaf schools. While the schools originally focused on teaching speech and reading, the students did something not seen or easily traceable in modern times: they spontaneously created a new language. By 1986, Dr. Judy Shepard-Kegl, an American Sign Language linguist, and her team of researchers observed the children, noting the clear distinctions between the first generation of signers and the second. Beyond communication, the children matured a sophisticated language within one generation. For many linguists, Nicaraguan Sign Language proved not only our innate desire to communicate but our abilities to create grammar and semantics to further nuance meaning.
This part focuses on how we harness that ability to create and share meaning: semantics. Beyond our abilities to communicate in real time, we are able to pass down knowledge through generations using both oral memorizations and written passages. This knowledge has transformed our trajectory and understanding of the world, just like the ability to create fire. Writing, in particular, allows us to build on knowledge in new and novel ways. It has transformed how we think and communicate, including how we visualize numbers and patterns.
Throughout the next chapters. we'll explore how semantics affects charts in isolation as well as together. We'll clarify a number of concepts that factor into linguistics and the semantic properties of what exactly charts express. Beyond charts as individual units, we'll also explore what happens when we combine them, including the grammatical constructs we impose while we design visualizations.
As we segue from perception to semantics, this section begins our journey to learn not only new names for things, but a whole new way to think about data visualization. Beyond perception, we'll look at how our brain finds patterns and systemizes them for meaning. The presentation of charts has matured to a new level of sophistication. Let's explore how the semantics of charts provides new light.

CHAPTER 4
Coming to Terms

As humans, we are innately curious creatures. We seek meaning, connection, certainty, and clarification in the world around us—whether it's looking at signs as we drive or finding a vegetarian meal to order by scanning a menu marked with icons or trying to understand the pointed gestures of our friend showing directions. Beyond pattern finding, we seek to find meaning in the world around us. To find meaning, we must establish a connection and come to reasonable terms, just as the Deaf children in Nicaragua did, as described in the Part B opening.
While meaning and understanding the various relationships and patterns in the world is second nature to us, describing it in a way that can be formalized is rather difficult and abstract. This is where semantics comes into play. Semantics is the study of how we draw meaning in communication (Cann et al., 2019). With semantics, we can explore how words or signs combine to convey a concept, why icons denote specific ideas, or which gestures effectively support a message. We can take these interactions—between ourselves or machines—and abstract them to find common patterns across different languages, cultures, and experiences. We can use a variety of cues to affirm our message, or we can send signals that conflict, making it hard for others to understand the message.
In data visualization, incorporating semantic elements can be as simple as including an icon showing people where to click or how to interact. A known graphic is a specific “click” arrow that we have seen thousands of times, placed in proximity to a chart. Close your eyes and you'll probably even have a specific arrow in mind. This task is done without long explanations or training. This is semantics at work. We've taken a visual abstraction, agreed on its meaning, and put it to use as a shared symbol.
Schematic illustration of a triangle. Each corner is labeled, theory, practice, and research.
Using symbols is one common way of applying semantics to help make sense of the world. Symbols provide clues to understanding experiences by conveying recognizable meanings that are shared by societies.
Sports uniforms, company logos, and traffic signs are symbols. In some cultures, a gold ring is a symbol of marriage. Placing your hands into the shape of a heart is also a symbol, one we can playfully toss to a friend across a variety of contexts. Other symbols are highly functional: stop signs, for instance, provide useful instruction for traffic flow. They are a ubiquitous form of what functional aesthetics provides, serving as pictographic representations of intent or purpose.
Figure 4.1 shows a variety of symbols. Which ones are meaningful to you?
These icons come in a variety of styles. When you see these out in the world, they are easy to spot, making them visually distinguishable. As you scan them, you can see the differences between all of these graphics. A symbol is perceptually distinguishable and semantically meaningful if you are part of the group that uses it. Even though we c...

Table of contents

  1. Cover
  2. Table of Contents
  3. Title Page
  4. Acknowledgments
  5. About the Authors
  6. About the Technical Editor
  7. Foreword
  8. Introduction
  9. PART A: Perception
  10. PART B: Semantics
  11. PART C: Intent
  12. PART D: Putting It All Together
  13. Technical Glossary
  14. Index
  15. Copyright
  16. Dedication
  17. End User License Agreement

Frequently asked questions

Yes, you can cancel anytime from the Subscription tab in your account settings on the Perlego website. Your subscription will stay active until the end of your current billing period. Learn how to cancel your subscription
No, books cannot be downloaded as external files, such as PDFs, for use outside of Perlego. However, you can download books within the Perlego app for offline reading on mobile or tablet. Learn how to download books offline
Perlego offers two plans: Essential and Complete
  • Essential is ideal for learners and professionals who enjoy exploring a wide range of subjects. Access the Essential Library with 800,000+ trusted titles and best-sellers across business, personal growth, and the humanities. Includes unlimited reading time and Standard Read Aloud voice.
  • Complete: Perfect for advanced learners and researchers needing full, unrestricted access. Unlock 1.4M+ books across hundreds of subjects, including academic and specialized titles. The Complete Plan also includes advanced features like Premium Read Aloud and Research Assistant.
Both plans are available with monthly, semester, or annual billing cycles.
We are an online textbook subscription service, where you can get access to an entire online library for less than the price of a single book per month. With over 1 million books across 990+ topics, we’ve got you covered! Learn about our mission
Look out for the read-aloud symbol on your next book to see if you can listen to it. The read-aloud tool reads text aloud for you, highlighting the text as it is being read. You can pause it, speed it up and slow it down. Learn more about Read Aloud
Yes! You can use the Perlego app on both iOS and Android devices to read anytime, anywhere — even offline. Perfect for commutes or when you’re on the go.
Please note we cannot support devices running on iOS 13 and Android 7 or earlier. Learn more about using the app
Yes, you can access Functional Aesthetics for Data Visualization by Vidya Setlur,Bridget Cogley in PDF and/or ePUB format, as well as other popular books in Computer Science & Business Intelligence. We have over one million books available in our catalogue for you to explore.