Like many industrialized regions, the Philadelphia metro area contains pockets of environmental degradation: neighborhoods littered with abandoned waste sites, polluting factories, and smoke-belching incinerators. However, other neighborhoods within and around the city are relatively pristine. This eye-opening book reveals that such environmental inequalities did not occur by chance, but were instead the result of specific policy decisions that served to exacerbate endemic classism and racism. From Workshop to Waste Magnet presents Philadelphia’s environmental history as a bracing case study in mismanagement and injustice. Sociologist Diane Sicotte digs deep into the city’s past as a titan of American manufacturing to trace how only a few communities came to host nearly all of the area’s polluting and waste disposal land uses. By examining the complex interactions among economic decline, federal regulations, local politics, and shifting ethnic demographics, she not only dissects what went wrong in Philadelphia but also identifies lessons for environmental justice activism today. Sicotte’s research tallies both the environmental and social costs of industrial pollution, exposing the devastation that occurs when mass quantities of society’s wastes mix with toxic levels of systemic racism and economic inequality. From Workshop to Waste Magnet is a compelling read for anyone concerned with the health of America’s cities and the people who live in them.
- 270 pages
- English
- ePUB (mobile friendly)
- Available on iOS & Android
eBook - ePub
From Workshop to Waste Magnet
About this book
Trusted by 375,005 students
Access to over 1.5 million titles for a fair monthly price.
Study more efficiently using our study tools.
Information
1
Measuring Environmental Inequalities in the Philadelphia Area in 2010
In the introduction, I’ve presented Chester City and Port Richmond, two Philadelphia area communities facing severe environmental inequality, in an effort to give the reader a bit of the flavor of what it is like to live there amid the environmental justice struggles each community faces. In this chapter, I’ll discuss my research and how I determined which communities in the Philadelphia area faced extreme environmental inequality, compared with others. I will also provide some numbers and maps to illustrate my findings.
The focus in this chapter and the historical ones that follow is on the Philadelphia Metropolitan Area (also known as “Greater Philadelphia”), which includes the City of Philadelphia (which is also Philadelphia County) and the four Pennsylvania counties that border Philadelphia (Bucks, Chester, Delaware, and Montgomery). It also includes three New Jersey counties just across the Delaware River from Philadelphia (Burlington, Camden, and Gloucester).
The Philadelphia area is especially suited for a study of the development of environmental inequality due to its industrial, environmental, and social histories. The city and its suburban manufacturing “satellite cities” have a long history of intense industrial activity, which gave rise to appalling levels of pollution and environmental damage. Philadelphia also played a long and fascinatingly contradictory role in the history of race and ethnic relations in the United States. It is the place where Quakers and others spirited slaves out of the South on the Underground Railroad; but it is also the place where African Americans were murdered and their homes burned in a series of antiblack riots during the same period in history. Throughout Philadelphia’s history, its African American job seekers faced a brick wall of racial discrimination when they sought a share of the prosperity of the booming manufacturing plants all around them. Yet Philadelphia is also one of the U.S. cities where there has always been a prosperous black middle class and black elite. It has also always been home to many impoverished and near-poor white people, some of whom struggled to make a living without dying in their industrial workplaces. Thus, Philadelphia’s history illustrates the multidimensional nature of both race and social class as conditions shaping environmental inequality.
At the beginning of Philadelphia’s industrial age, most of the largest industrial plants in “noxious” industries—industries producing smoke, noise, and bad smells—were located not in the center of Philadelphia, but rather in industrial suburbs on the outskirts of the city. Those who worked there tended to live close by, in small rowhomes near the plants. Farther away from the city were the homes of the privileged—those who may have invested in factories but did not work in the factory. These wealthy communities are as much a part of the story of how environmental inequalities were produced as are poor and working-class communities; yet, the privileged, and the way in which their racial and class privileges are mobilized to obtain environmental privilege, are usually ignored in environmental justice studies.1
Since the Philadelphia area is characterized by a high level of social class inequality, it also includes a number of these privileged communities, allowing for an examination of their role in the development of environmental inequality. For this reason, it was important to include the suburbs as well as the city in this study of environmental inequality.
To trace communities through history, it is necessary to choose a definition of “community” that carries with it some type of social identity and sets it apart from other communities. Municipalities (boroughs, cities, and towns) have a social identity, including social class and racial/ethnic identities; and they specialize in certain types of employment. They also have legal boundaries, clear borders that set them apart from other places. Thus, communities outside Philadelphia are defined as the 339 boroughs, cities, and townships bordering Philadelphia but outside its boundaries. Within the city, it was a bit more difficult to define “communities.” Census tracts did not qualify, as they have no social identity; they were also much smaller than suburban towns. Neighborhoods were better than census tracts, since they have strong social identities; but like census tracts, they were too small in area to compare with suburban towns. Also, in Philadelphia neighborhood residents debate and disagree about the boundaries of their neighborhoods—in fact, there is even disagreement over how many neighborhoods actually exist in the city. The best definition for communities was the twelve Planning Analysis Areas used by the Philadelphia City Planning Commission, each of which contained more than one neighborhood.2 (See the appendix for a more detailed description of methodology.) Census data were added to maps of the twelve Planning Analysis Areas and the suburban towns that surround Philadelphia, yielding a picture of the racial/ethnic composition of all Philadelphia area communities and the median household income of each community (see maps 1 and 2).3
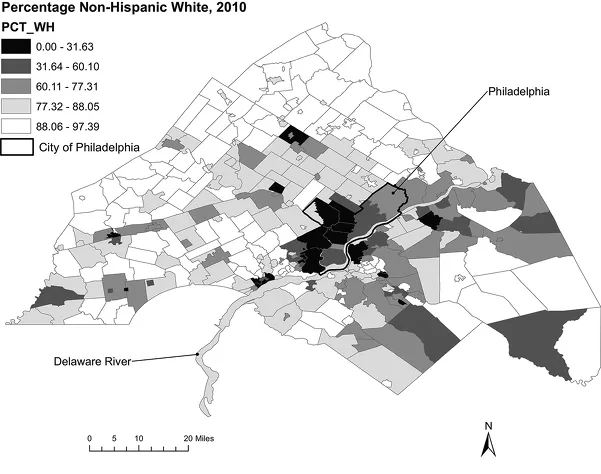
Map 1. Philadelphia area communities by percentage non-Hispanic white, 2010. Source: U.S. Census.
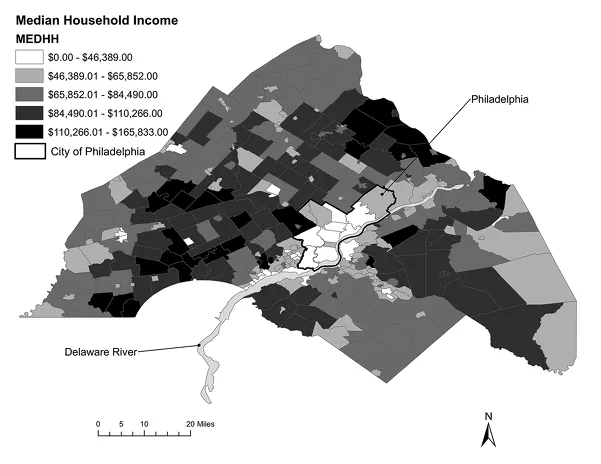
Map 2. Philadelphia area communities by median household income, 2010. Source: U.S. Census.
Since this study examines the development of environmental inequality, perhaps it is time for some discussion about what “environmental inequality” means. Although all terms connected with environmental justice tend to have multiple meanings, it is fair to say that environmental inequality describes a wide range of conditions in which the environment in one place is less beautiful, healthy, or safe than the environment in another place.4 One type of environmental inequality is distributional inequality, which refers to difference, unevenness, or inequality in the distribution of environmental “bads” (such as polluting factories, power plants, or waste disposal facilities).5 Distributional inequality can also describe an unfair distribution of environmental “goods” (such as tree cover, access to parks and other places for safe recreation, and access to public transportation); in the Philadelphia area, as in most places, environmental goods tend to be clustered in very different places than environmental bads.
In the Philadelphia area, “environmental bads” include Superfund sites; electric power plants; polluting factories listed on the Toxic Release Inventory (TRI); commercial hazardous waste treatment, storage, and disposal facilities (TSDFs); incinerators; municipal, construction, and industrial landfills; large sewage treatment plants or sludge management facilities; and trash transfer stations (listed in table 1, along with a breakdown of the points assigned to symbolize the hazardousness of each type of facility). Using GIS, I mapped each facili...
Table of contents
- Title Page
- Copyright Page
- Contents
- List of Figures
- List of Maps
- List of Tables
- Acknowledgments
- Introduction
- Chapter 1. Measuring Environmental Inequalities in the Philadelphia Area in 2010
- Chapter 2. Theorizing Urban Environmental Inequality
- Chapter 3. The Rise of Industrial Philadelphia
- Chapter 4. Environmental Inequality from 1950 to 1969
- Chapter 5. The Making of Waste Magnets: Environmental Burdening after 1970
- Chapter 6. Intersectionality and Environmental Inequality in the Philadelphia Region
- Chapter 7. Toward a “Rust Belt” Theory of U.S. Environmental Inequality
- Appendix: Nature of This Study
- Notes
- Index
- About the Author
Frequently asked questions
Yes, you can cancel anytime from the Subscription tab in your account settings on the Perlego website. Your subscription will stay active until the end of your current billing period. Learn how to cancel your subscription
No, books cannot be downloaded as external files, such as PDFs, for use outside of Perlego. However, you can download books within the Perlego app for offline reading on mobile or tablet. Learn how to download books offline
Perlego offers two plans: Essential and Complete
- Essential is ideal for learners and professionals who enjoy exploring a wide range of subjects. Access the Essential Library with 800,000+ trusted titles and best-sellers across business, personal growth, and the humanities. Includes unlimited reading time and Standard Read Aloud voice.
- Complete: Perfect for advanced learners and researchers needing full, unrestricted access. Unlock 1.5M+ books across hundreds of subjects, including academic and specialized titles. The Complete Plan also includes advanced features like Premium Read Aloud and Research Assistant.
We are an online textbook subscription service, where you can get access to an entire online library for less than the price of a single book per month. With over 1.5 million books across 990+ topics, we’ve got you covered! Learn about our mission
Look out for the read-aloud symbol on your next book to see if you can listen to it. The read-aloud tool reads text aloud for you, highlighting the text as it is being read. You can pause it, speed it up and slow it down. Learn more about Read Aloud
Yes! You can use the Perlego app on both iOS and Android devices to read anytime, anywhere — even offline. Perfect for commutes or when you’re on the go.
Please note we cannot support devices running on iOS 13 and Android 7 or earlier. Learn more about using the app
Please note we cannot support devices running on iOS 13 and Android 7 or earlier. Learn more about using the app
Yes, you can access From Workshop to Waste Magnet by Diane Sicotte in PDF and/or ePUB format, as well as other popular books in Biological Sciences & Ecology. We have over 1.5 million books available in our catalogue for you to explore.