- 163 pages
- English
- ePUB (mobile friendly)
- Available on iOS & Android
eBook - ePub
Business Intelligence and Data Mining
About this book
"This book is a splendid and valuable addition to this subject. The whole book is well written and I have no hesitation to recommend that this can be adapted as a textbook for graduate courses in Business Intelligence and Data Mining." Dr. Edi Shivaji, Des Moines, Iowa "As a complete novice to this area just starting out on a MBA course I found the book incredibly useful and very easy to follow and understand. The concepts are clearly explained and make it an easy task to gain an understanding of the subject matter." -- Mr. Craig Domoney, South Africa. Business Intelligence and Data Mining is a conversational and informative book in the exploding area of Business Analytics. Using this book, one can easily gain the intuition about the area, along with a solid toolset of major data mining techniques and platforms. This book can thus be gainfully used as a textbook for a college course. It is also short and accessible enough for a busy executive to become a quasi-expert in this area in a couple of hours. Every chapter begins with a case-let from the real world, and ends with a case study that runs across the chapters.
Trusted by 375,005 students
Access to over 1.5 million titles for a fair monthly price.
Study more efficiently using our study tools.
Information
CHAPTER 1
Wholeness of Business Intelligence and Data Mining
Business is the act of doing something productive to serve someone’s needs, and thus earn a living and make the world a better place. Business activities are recorded on paper or using electronic media, and then these records become data. There is more data from customers’ responses and on the industry as a whole. All this data can be analyzed and mined using special tools and techniques to generate patterns and intelligence, which reflect how the business is functioning. These ideas can then be fed back into the business so that it can evolve to become more effective and efficient in serving customer needs. And the cycle continues on (Figure 1.1).
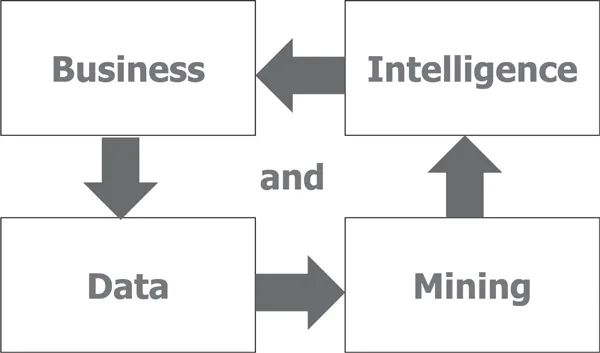
Figure 1.1 Business intelligence and data mining cycle
Business Intelligence
Any business organization needs to continually monitor its business environment and its own performance, and then rapidly adjust its future plans. This includes monitoring the industry, the competitors, the suppliers, and the customers. The organization needs to also develop a balanced scorecard to track its own health and vitality. Executives typically determine what they want to track based on their key performance Indexes (KPIs) or key result areas (KRAs). Customized reports need to be designed to deliver the required information to every executive. These reports can be converted into customized dashboards that deliver the information rapidly and in easy-to-grasp formats.
Caselet: MoneyBall—Data Mining in Sports
Analytics in sports was made popular by the book and movie, Moneyball. Statistician Bill James and Oakland A’s General Manager Billy Bean placed emphasis on crunching numbers and data instead of watching an athlete’s style and looks. Their goal was to make a team better while using fewer resources. The key action plan was to pick important role players at a lower cost while avoiding the famous players who demand higher salaries but may provide a low return on a team’s investment. Rather than relying on the scouts’ experience and intuition Bean selected players based almost exclusively on their on-base percentage (OBP). By finding players with a high OBP but, with characteristics that lead scouts to dismiss them, Bean assembled a team of undervalued players with far more potential than the A’s hamstrung finances would otherwise allow.
Using this strategy, they proved that even small market teams can be competitive—a case in point, the Oakland A’s. In 2004, two years after adopting the same sabermetric model, the Boston Red Sox won their first World Series since 1918. (Source: Moneyball 2004)
Q1. Could similar techniques apply to the games of soccer, or cricket? If so, how?
Q2. What are the general lessons from this story?
Business intelligence is a broad set of information technology (IT) solutions that includes tools for gathering, analyzing, and reporting information to the users about performance of the organization and its environment. These IT solutions are among the most highly prioritized solutions for investment.
Consider a retail business chain that sells many kinds of goods and services around the world, online and in physical stores. It generates data about sales, purchases, and expenses from multiple locations and time frames. Analyzing this data could help identify fast-selling items, regional-selling items, seasonal items, fast-growing customer segments, and so on. It might also help generate ideas about what products sell together, which people tend to buy which products, and so on. These insights and intelligence can help design better promotion plans, product bundles, and store layouts, which in turn lead to a better-performing business.
The vice president of sales of a retail company would want to track the sales to date against monthly targets, the performance of each store and product category, and the top store managers that month. The vice president of finance would be interested in tracking daily revenue, expense, and cash flows by store; comparing them against plans; measuring cost of capital; and so on.
Pattern Recognition
A pattern is a design or model that helps grasp something. Patterns help connect things that may not appear to be connected. Patterns help cut through complexity and reveal simpler understandable trends. Patterns can be as definitive as hard scientific rules, like the rule that the sun always rises in the east. They can also be simple generalizations, such as the Pareto principle, which states that 80 percent of effects come from 20 percent of the causes.
A perfect pattern or model is one that (a) accurately describes a situation, (b) is broadly applicable, and (c) can be described in a simple manner. E = MC2 would be such a general, accurate, and simple (GAS) model. Very often, all three qualities are not achievable in a single model, and one has to settle for two of three qualities in the model.
Patterns can be temporal, which is something that regularly occurs over time. Patterns can also be spatial, such as things being organized in a certain way. Patterns can be functional, in that doing certain things leads to certain effects. Good patterns are often symmetric. They echo basic structures and patterns that we are already aware of.
A temporal rule would be that “some people are always late,” no matter what the occasion or time. Some people may be aware of this pattern and some may not be. Understanding a pattern like this would help dissipate a lot of unnecessary frustration and anger. One can just joke that some people are born “10 minutes late,” and laugh it away. Similarly, Parkinson’s law states that works expands to fill up all the time available to do it.
A spatial pattern, following the 80–20 rule, could be that the top 20 percent of customers lead to 80 percent of the business. Or 20 percent of products generate 80 percent of the business. Or 80 percent of incoming customer service calls are related to just 20 percent of the products. This last pattern may simply reveal a discrepancy between a product’s features and what the customers believe about the product. The business can then decide to invest in educating the customers better so that the customer service calls can be significantly reduced.
A functional pattern may involve test-taking skills. Some students perform well on essay-type questions. Others do well in multiple-choice questions. Yet other students excel in doing hands-on projects, or in oral presentations. An awareness of such a pattern in a class of students can help the teacher design a balanced testing mechanism that is fair to all.
Retaining students is an ongoing challenge for universities. Recent data-based research shows that students leave a school for social reasons more than they do for academic reasons. This pattern/insight can instigate schools to pay closer attention to students engaging in extracurricular activities and developing stronger bonds at school. The school can invest in entertainment activities, sports activities, camping trips, and other activities. The school can also begin to actively gather data about every student’s participation in those activities, to predict at-risk students and take corrective action.
However, long-established patterns can also be broken. The past cannot always predict the future. A pattern like “all swans are white” does not mean that there may not be a black swan. Once enough anomalies are discovered, the underlying pattern itself can shift. The economic meltdown in 2008 to 2009 was because of the collapse of the accepted pattern, that is, “housing prices always go up.” A deregulated financial environment made markets more volatile and led to greater swings in markets, leading to the eventual collapse of the entire financial system.
Diamond mining is the act of digging into large amounts of unrefined ore to discover precious gems or nuggets. Similarly, data mining is the act of digging into large amounts of raw data to discover unique nontrivial useful patterns. Data is cleaned up, and then special tools and techniques can be applied to search for patterns. Diving into clean and nicely organized data from the right perspectives can increase the chances of making the right discoveries.
A skilled diamond miner knows what a diamond looks like. Similarly, a skilled data miner should know what kinds of patterns to look for. The patterns are essentially about what hangs together and what is separate. Therefore, knowing the business domain well is very important. It takes knowledge and skill to discover the patterns. It is like finding a needle in a haystack. Sometimes the pattern may be hiding in plain sight. At other times, it may take a lot of work, and looking far and wide, to find surprising useful patterns. Thus, a systematic approach to mining data is necessary to efficiently reveal valuable insights.
For instance, the attitude of employees toward their employer may be hypothesized to be determined by a large number of factors, such as level of education, income, tenure in the company, and gender. It may be surprising if the data reveals that the attitudes are determined first and foremost by their age bracket. Such a simple insight could be powerful in designing organizations effectively. The data miner has to be open to any and all possibilities.
When used in clever ways, data mining can lead to interesting insights and be a source of new ideas and initiatives. One can predict the traffic pattern on highways from the movement of cell phone (in the car) locations on the highway. If the locations of cell phones on a highway or roadway are not moving fast enough, it may be a sign of traffic congestion. Telecom companies can thus provide real-time traffic information to the drivers on their cell phones, or on their GPS devices, without the need of any video cameras or traffic reporters.
Similarly, organizations can find out an employee’s arrival time at the office by when their cell phone shows up in the parking lot. Observing the record of the swipe of the parking permit card in the company parking garage can inform the organization whether an employee is in the office building or out of the office at any moment in time.
Some patterns may be so sparse that a very large amount of diverse data has to be seen together to notice any connections. For instance, locating the debris of a flight that may have vanished midcourse would require bringing together data from many sources, such as satellites, ships, and navigation systems. The raw data may come with various levels of quality, and may even be conflicting. The data at hand may or may not be adequate for finding good patterns. Additional dimensions of data may need to be added to help solve the problem.
Data Processing Chain
Data is the new natural resource. Implicit in this statement is the recognition of hidden value in data. Data lies at the heart of business intelligence. There is a sequence of steps to be followed to benefit from the data in a systematic way. Data can be modeled and stored in a database. Relevant data can be extracted from the operational data stores according to certain reporting and analyzing purposes, and stored in a data warehouse. The data from the warehouse can be combined with other sources of data, and mined using data mining techniques to generate new insights. The insights need to be visualized and communicated to the right audience in real time for competitive advantage. Figure 1.2 explains the progression of data processin...
Table of contents
- Cover
- Half Title Page
- Title Page
- Copyright
- Dedication
- Abstract
- Contents
- Preface
- Chapter 1 Wholeness of Business Intelligence and Data Mining
- Section 1
- Section 2
- Section 3
- Additional Resources
- Index
Frequently asked questions
Yes, you can cancel anytime from the Subscription tab in your account settings on the Perlego website. Your subscription will stay active until the end of your current billing period. Learn how to cancel your subscription
No, books cannot be downloaded as external files, such as PDFs, for use outside of Perlego. However, you can download books within the Perlego app for offline reading on mobile or tablet. Learn how to download books offline
Perlego offers two plans: Essential and Complete
- Essential is ideal for learners and professionals who enjoy exploring a wide range of subjects. Access the Essential Library with 800,000+ trusted titles and best-sellers across business, personal growth, and the humanities. Includes unlimited reading time and Standard Read Aloud voice.
- Complete: Perfect for advanced learners and researchers needing full, unrestricted access. Unlock 1.5M+ books across hundreds of subjects, including academic and specialized titles. The Complete Plan also includes advanced features like Premium Read Aloud and Research Assistant.
We are an online textbook subscription service, where you can get access to an entire online library for less than the price of a single book per month. With over 1.5 million books across 990+ topics, we’ve got you covered! Learn about our mission
Look out for the read-aloud symbol on your next book to see if you can listen to it. The read-aloud tool reads text aloud for you, highlighting the text as it is being read. You can pause it, speed it up and slow it down. Learn more about Read Aloud
Yes! You can use the Perlego app on both iOS and Android devices to read anytime, anywhere — even offline. Perfect for commutes or when you’re on the go.
Please note we cannot support devices running on iOS 13 and Android 7 or earlier. Learn more about using the app
Please note we cannot support devices running on iOS 13 and Android 7 or earlier. Learn more about using the app
Yes, you can access Business Intelligence and Data Mining by Anil Maheshwari in PDF and/or ePUB format, as well as other popular books in Business & Information Management. We have over 1.5 million books available in our catalogue for you to explore.