- 1,264 pages
- English
- ePUB (mobile friendly)
- Available on iOS & Android
eBook - ePub
About this book
Traffic crashes are one of the ten leading causes of deaths worldwide, and the leading cause of death for young people in the western world - a seemingly necessary evil that accompanies increasing levels of motorization. In this comprehensive 2nd edition of the classic "Traffic Safety and Human Behavior" Dr David Shinar provides a theoretical framework and a critical evaluation of the most recent research findings to comprehend the complexity of traffic safety and the central role that road users - drivers, motorcyclists, bicyclists, and pedestrians play in it. In the new edition of approximately 1000 pages with nearly 300 graphs and tables, Shinar covers the key issues that relate human behavior to traffic safety and the impact that cultural, policy, and technological changes have on them. In particular the new edition covers the increasing roles that pedestrians and cyclists have in the traffic system and the need to accommodate them; the intrusion of infotainment and its role in driver distraction; and the increasing role of crash-prevention and driver assistance systems in changing the driver-vehicle interaction.
Tools to learn more effectively

Saving Books

Keyword Search

Annotating Text

Listen to it instead
Information
Edition
2DRIVER TEMPORARY IMPAIRMENTS
11
ALCOHOL AND DRIVING
“It provokes the desire, but it takes away the performance.” (Shakespeare, Macbeth, Act 2, Scene 3).
“Transport mishaps related to alcohol impairment are not new. It was common knowledge in the pre-industrial age that drunkards were at increased risk when riding horses or driving horse drawn vehicles, but to a limited extent a good horse could share the responsibility for safe transport with an incompetent driver, compensate for human impairment, and plod homeward in relative safety. The advent of the horseless carriage brought the era of forgiving transportation to an end.” (Ogden and Moskowitz, 2004).
DRIVE HAMMERED, GET NAILED. A popular public message on roadside billboards against drinking and driving.
Shakespeare was correct: alcohol has a lure, but it also has a cost. Mixing alcohol and driving makes for a terrible cocktail. Drinking and driving, or as it is commonly labeled driving under the influence (DUI) or driving while intoxicated (DWI), is probably the single greatest contributor to road deaths in the Western world. In fact, in the U.S. it is of such concern that it is included in many health and life-expectancy indicators. Because of its prominence as a cause of death, and concerted efforts to combat it, over the past four decades there have been significant reductions in the frequency of drinking and driving in the U.S. This is reflected in both self-reported annual national surveys of drivers (Shinar, Schechtman, and Compton, 1999), and in the drops of the share of alcohol in traffic fatality statistics; from 51 percent of all traffic fatalities in 1989 to 31 percent of all traffic fatalities in 2013 (NHTSA, 2015a) and from 0.45 fatalities per 100 million vehicle-miles in 2005 to 0.33 in 2014 (NHTSA, 2015c). In the EU, the situation is slightly better with alcohol impairment (defined there as BAC > .05) accounting for approximately 25 percent of traffic fatalities (Mercier-Guyon, 2014).
The direct reason for the marked improvement is simple: fewer and fewer people drink and drive. The most direct evidence of the positive change is in nationally representative roadside sobriety checkpoints (Berning, Compton, and Wochinger, 2015). In these checks, alcohol at any level dropped from 36 percent of all weekend night drivers in 1973 to 8 percent in 2013-2014. The change in the prevalence of alcohol above the legal limit of .08 percent in that period dropped by 80 percent: from 7.5 percent to 1.5 percent (Berning et al., 2015). There are probably multiple reasons for this positive behavioral change, but at least two are the emergence and impact of grass-roots citizen groups against drinking and driving (such as MADD – Mothers Against Drunk Driving), and the proliferation of effective laws and severe penalties.
The efforts to combat drinking and driving did not occur in a scientific vacuum. There is probably no area related to driving safety that has received more attention from researchers than that of drinking and driving. In fact, the body of scientific knowledge in this area is so extensive relative to the efforts actually made to reduce the problem that in a conference of leading highway safety researchers 10 years ago none of the participants identified research in this area as one of the top priorities. Not because it is not important, but because progress in this area was perceived as being impeded mostly by insufficient implementation of the knowledge that already exists due to political lack of will, and not for lack of knowledge (Hedlund, 2006).
Part of the problem, at least, is that drinking is a socially common and acceptable behavior in most parts of the world (save some Moslem countries). Worldwide, the average 15+ years old person consumes 6.2 liters of pure alcohol per year, which amount to 13.5 grams of alcohol per day (WHO, 2014). This is roughly equivalent to a can of beer per day (depending on the strength of the beer). The variability around that figure is very high, with some countries being very low (e.g., Israel = 2.8 l/yr), some being quite high (e.g., U.S.= 9.2), and some being very high (e.g., Russia = 15.1) (WHO, 2014). Europe is by far the heaviest drinking region in the world with most countries reporting more than 15 liters of pure alcohol per year per person (based on 2003-2005 data. WHO, 2010). Consequently, in this social climate absolute prohibition is not a viable countermeasure to DWI.
To understand the nature of the DWI problem and its countermeasures, it is necessary to first discuss the process by which alcohol affects various human functions, and the effects it has on driving and driving-related skills. I then address the impact of drinking on crashes, and the various countermeasures that have been used to reduce the problem.
ALCOHOL ABSORPTION, ELIMINATION AND BLOOD ALCOHOL CONCENTRATION (BAC)
Alcohol, also known as the “wet drug” is a psychoactive drug. It is usually ingested in a drink (though thanks to technology it does not have to be a liquid anymore; AWOL, 2006). The alcohol in our drinks – ethanol or ethyl alcohol – is one of a family of compounds classified as alcohol. It is a colorless liquid that mixes in other fluids to form a homogenous liquid. Alcohol is absorbed in the blood stream very quickly because it does not have to be digested, and it passes quickly into the blood stream through the stomach walls (approximately 20 percent) and the walls of the small intestines (80 percent). It then spreads through the vascular system to rapidly reach the various tissues, including the nerve centers in the brain where it exerts its effects on multiple perceptual, cognitive, memory, and motor functions – all critical for safe driving (Ogden and Moskowitz, 2004). Because it spreads through the vascular system, its highest concentrations are in the blood-rich tissues of the brain, the liver, and the muscles. The rate of absorption of alcohol into the blood system is slowed down if we combine its intake with food, because the presence of food in the digestive tract slows its absorption. The elimination of alcohol from the body is a much slower process. Minute portions are eliminated through our breath, sweat, and urine, but most of the alcohol is eliminated slowly through metabolism in the liver.
The standard measure of alcohol in the blood is expressed in terms of percent of milligrams of alcohol per milliliter of blood. Although this is a ratio of weight per volume, we still think of this ratio as dimensionless because blood and alcohol weigh almost the same: 1 milliliter of water weighs 1.00 gram and 1 milliliter of blood weighs 1.05 grams. Thus, we typically express the amount of alcohol as percent Blood Alcohol Concentration (BAC). A concentration of 1 gram alcohol per 1 milliliter of blood would then yield BAC = 100 percent, and 1 milligram of alcohol (one thousandth of a gram) per 1 milliliter of blood would yield a BAC = 0.1 percent. A detailed description of the BAC measure and factors that affect it is provided by Brick (2006).
With this notation in mind, we can now quantify the rate of absorption and elimination of various amounts of alcohol. Figure 11-1 (based on data by Wilkinson et al., 1977) presents the BAC reached at different times after drinking alcohol, when it is consumed all at once on an empty stomach. Several things should be noted in this figure. First, as can be seen from the multiple graphs in this figure, the peak alcohol level reached and the time it takes the body to dispose of it are directly related to the amount of alcohol consumed. Second, alcohol absorption is much quicker than its metabolism or elimination. The elimination is relatively slow and averages 0.017 percent per hour (NHTSA, 1994); being slightly faster for an experienced drinker and slightly slower for an inexperienced one. Thus, a person who reaches a BAC = 0.05 percent needs more than 3 hours to get the alcohol out of his or her system. Third, peak BAC level is reached approximately 30-60 minutes after drinking. This means that a person, who stops at a bar for a few drinks, may actually have a higher BAC – and therefore be more intoxicated – sometime after he or she has started driving than at the time he or she left the bar and entered the car. This also means that a person may feel quite “fine” getting into the car, and then may deteriorate without being aware of this.
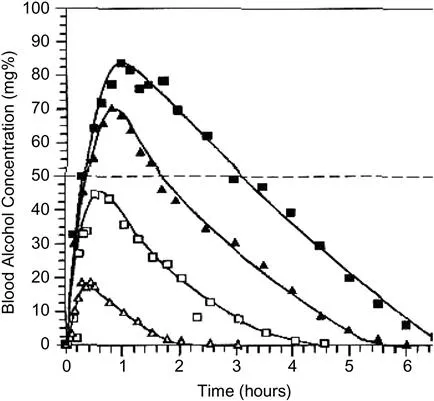
Figure 11-1. The rates of absorption and elimination, and the peak levels of BAC reached after drinking 1 (lowest curve), 2 (second curve), 3, and 4 drinks. The curves are based on drinking the whole quantity at once, on an empty stomach, by a male of average weight (from Boggan, 2005, based on data from Wilkinson et al., 1977, with kind permission from Springer Science and Business Media).
Not apparent from Figure 11-1 are two other important facts. First, the peak BAC will be lower if a person consumes these drinks while eating (as in a restaurant), and over a long period. This is because the food slows the absorption process and the duration of the drinking period allows for some of the alcohol to be eliminated even though more alcohol is still being consumed. Second, the individual differences in the rates of absorption and elimination are quite significant, especially in the elimination (Christoforou, Karlaftis, and Yannis, 2013). This also means that the absolute levels of BAC at different times in the curves in Figure 11-1 can be misleading because the elimination process can be slightly faster for some people, but significantly slower for others (Boggan, 2005). Gender is also an important factor. In general, the same amount of alcohol ingested by a man and a woman of equal weight will result in a higher BAC in the woman than in the man. This is because the effect of the alcohol is a function of its dilution in the blood, and while water is 58 percent of an average man’s weight, it is only 49 percent of an average woman’s weight.
As a matter of procedure the measurement of a driver’s BAC is most often not based on direct measurement of the blood content. Instead drivers are asked to blow into a portable breath tester and their lung air is analyzed. Because the breath alcohol concentration is highly correlated with the level of alcohol in the arterial and venous blood (Linderg et al., 2007), and is proportional to the BAC by a factor of 2.2727 (Vanlaar, 2005), the breath alcohol content can be easily converted into blood alcohol concentration. For example, a breath alcohol concentration of 0.22 mg alcohol per liter of exhaled air is equivalent to 0.5 g/l in the blood, or 0.05 percent BAC. Although this relationship is a statistically reliable one, it is a bit problematic when used to assess levels at or near the legal threshold (Schechtman and Shinar, 2011. See Enforcement section below).
ALCOHOL EFFECTS ON DRIVING, ON DRIVING-RELATED TASKS, AND ON SUBJECTIVE SENSATIONS
Alcohol effects on cognitive and psychomotor functioning
Alcohol affects just about every capacity that we have, and performance deteriorations have been documented for just about every perceptual, attentional, decision, memory, and psychomotor task that has been evaluated. In fact, alcohol effects are so pervasive and consistent that the World Health Organization recommends that alcohol-related impairment serve as a benchmark for other impairments (Willette and Walsh, 1983). As might be expected, in general there is a direct dose-response relationship so that the amount of impairment is directly related to the amount of alcohol that enters the blood. The impairing effects can be demonstrated at very low alcohol levels and as the amount of alcohol in the blood rises, the number of functions that are impaired and degree of impairment increases (Moskowitz and Fiorentino, 2000; Moskowitz and Robinson, 1988; Ogden and Moskowitz, 2004).
The literature on the effects of alcohol on driving and driving-related functions is very extensive and the findings are very consistent: alcohol in almost any amount impairs driving or driving-related skills. In a review of the literature, Moskowitz and Robinson (1988) analyzed the results of 177 studies that examined the effects of low levels of alcohol (BAC levels of 0.10 percent or less) on driving-related functions and behaviors. They summarized their results in terms of the likelihood of impairment as a function of the BAC for nine different driving-related categories that are listed in Figure 11-2: reaction time, tracking, vigilance, divided attention, information processing, visual function, perception, psychomotor skills, and driving skill. Several aspects of their findings are significant. First and most obvious, as the BAC level increases the likelihood of finding impairment increases. This is true for all functions studied. Second, at BAC = 0.10 percent all the studies reviewed (100 percent of the studies in each category evaluated) indicated that all aspects of driving behaviors are impaired. Third, there are differences among the functions in their sensitivity to alcohol. The most sensitive function – producing impairment at the lowest levels of BAC – was divided attention. Approximately 50 percent of the studies demonstrate impairment in divided attention at BAC < 0.05 percent. The next most sensitive function was tracking, with similar percentages showing impairment at BAC = 0.05 percent. These findings are quite significant for safe driving because tracking and divided attention are inherent in just about all driving tasks, and inattention or distraction is involved in roughly 50 percent of all crashes (see Chapters 13, 18). The least sensitive function was vigilance, with very few studies showing impairment below BAC = 0.08 percent.
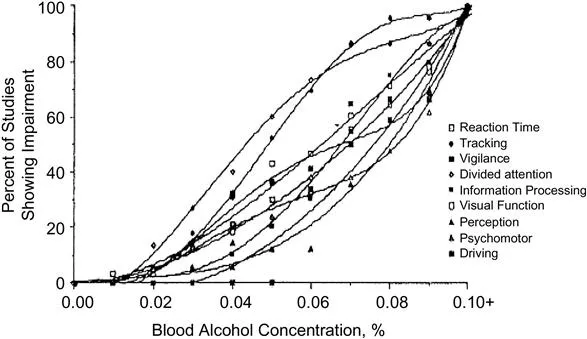
Figure 11-2. The percent of studies showing impairment from alcohol at different BACs for different categories of driving-related behavior...
Table of contents
- Cover
- Title Page
- Part A - Background, Methods, and Models
- Part B - Driver Capacities and Individual Differences
- Part C - Driving Style
- Part D - Driver Temporary Impairments
- Part E - Vulnerable Road Users
- Part F - Crash Causation and Countermeasures
- Glossary of Acronyms
- Author Index
- Subject Index
Frequently asked questions
Yes, you can cancel anytime from the Subscription tab in your account settings on the Perlego website. Your subscription will stay active until the end of your current billing period. Learn how to cancel your subscription
No, books cannot be downloaded as external files, such as PDFs, for use outside of Perlego. However, you can download books within the Perlego app for offline reading on mobile or tablet. Learn how to download books offline
Perlego offers two plans: Essential and Complete
- Essential is ideal for learners and professionals who enjoy exploring a wide range of subjects. Access the Essential Library with 800,000+ trusted titles and best-sellers across business, personal growth, and the humanities. Includes unlimited reading time and Standard Read Aloud voice.
- Complete: Perfect for advanced learners and researchers needing full, unrestricted access. Unlock 1.4M+ books across hundreds of subjects, including academic and specialized titles. The Complete Plan also includes advanced features like Premium Read Aloud and Research Assistant.
We are an online textbook subscription service, where you can get access to an entire online library for less than the price of a single book per month. With over 1 million books across 990+ topics, we’ve got you covered! Learn about our mission
Look out for the read-aloud symbol on your next book to see if you can listen to it. The read-aloud tool reads text aloud for you, highlighting the text as it is being read. You can pause it, speed it up and slow it down. Learn more about Read Aloud
Yes! You can use the Perlego app on both iOS and Android devices to read anytime, anywhere — even offline. Perfect for commutes or when you’re on the go.
Please note we cannot support devices running on iOS 13 and Android 7 or earlier. Learn more about using the app
Please note we cannot support devices running on iOS 13 and Android 7 or earlier. Learn more about using the app
Yes, you can access Traffic Safety and Human Behavior by David Shinar in PDF and/or ePUB format, as well as other popular books in Technology & Engineering & Automotive Transportation & Engineering. We have over one million books available in our catalogue for you to explore.