ABSTRACT
The financial crisis of 2008 and ensuing recession led to falls in earnings in the United Kingdom, not seen since the Great Depression of the 1930s, and it was only in 2014 that overall household income returned to its pre-crisis levels. At the same time, according to one official measure, income inequality has actually fallen, although different data indicate no change. This situation follows from several factors, notably the continued growth in pensions, higher earnings of lower-income households as these have worked more since the recovery in 2013, and the continued stagnation of earnings in higher income households (even if very high incomes have continued to pull away from the rest of the population). Incomes of younger workers also remain below their pre-crisis peak. This chapter shows, however, that the picture of poverty and inequality in the United Kingdom is far more complex than suggested by the main measure of income inequality. To this end, it begins by reviewing the definitions of poverty and inequality, in order to provide a broader overview of these pressing but complex social problems. The chapter goes on to examine wealth inequalities, the impact of housing costs on inequality and poverty, and it concludes by presenting recent studies suggesting that Brexit may well lead to future rises in inequality, as higher inflation could well hit lower-income households most.
INTRODUCTION
In the years following the financial crisis of 2008, the standard rate of income inequality using one key official measure in the United Kingdom fell. According to the Office for National Statistics (ONS), inequality in Britain in 2016 was back to the levels recorded in the mid-1980s, a decade in which inequality rose strongly. This may sound paradoxical, given the long squeeze on household incomes following the financial crisis, and the divisions in British society exposed by the Brexit vote, but it reflects the opaque nature of poverty, inequality and calculations based on averages: other government figures suggest there has been no change.
This chapter seeks to describe and explain the evolution of inequality since 2008. It will look at what lies behind and beyond the standard definition of inequality which refers to equivalised disposable household income. The chapter here includes more contextual information about inequality, examining poverty trends in recent decades and changes in wealth inequality, which is far greater and more difficult to identify.
It must be stressed that this presentation is based on aggregate statistics. These shroud the harsh reality of poverty which in many ways is invisible, hidden behind closed doors or confined to marginalised neighbourhoods. Documentaries and deeper academic studies like Stewart Lansley and Joanna Mack’s Breadline Britain (2015) can partly relate the daily misery of poverty. So too can writers: yesterday George Orwell in The Road to Wigan Pier, today perhaps JK Rowling in her description of ‘The Fields’ sink estate in The Casual Vacancy. The films by Ken Loach also stand out, not because they show something unusual, but because they contrast with the sanitised image of society and history shown by mainstream media, such as the beautifully made Downton Abbey. Aggregate numbers provide an overall picture but say little about the real lives of millions.
The chapter begins by briefly recalling the basic definitions of poverty and inequality as given in official statistics. It then reviews the evolution of inequality in the United Kingdom since the financial crisis, and more generally since the rise of neoliberalism. Next, the chapter provides key figures on poverty since the financial crisis. Finally, the conclusion touches on some forecasts of future trends in inequality and poverty, especially in the light of Brexit.
UNDERSTANDING STANDARD MEASURES OF POVERTY AND INEQUALITY
The standard rate of inequality has been flat or perhaps even falling in recent years, depending on the data, even though the financial crisis led to the biggest drop in household incomes since the Great Depression. These two trends are not contradictory, but need explaining, and so it is necessary to look at the basic concepts of poverty and inequality. These are deeply divisive in most societies, because they are central to political identities and fundamental social struggles. One emphatic view of equality as a political dividing line was given, for example, by David Willets (1992, p. 109),1 writing in the heyday of the Thatcher-Major years. In defining Modern Conservatism, Willets notes that ‘there is one key idea, seductive, and with a strong emotional appeal, which cannot be absorbed into conservative thought: egalitarianism. Socialism may be dying but not the idea of equality. It is now the key, anti-conservative concept’.
Defining Poverty
This kind of political cleavage runs deep in discussions about poverty and inequality, and is reflected in the way these phenomena are measured. At the risk of simplification, the conservative approach to measuring poverty is based on looking at people and households living below an absolute level of poverty. This usually involves calculating the cost of a basket of goods and services individuals or households need to subsist in extremely straightened circumstances. This approach is used in the United States, surely reflecting its more individualistic political culture, and is coherent with the United States as a ‘liberal welfare state’ in Esping-Andersen’s terminology (Esping-Andersen, 1990). In this case, the poverty line is calculated on the basis of a ‘dollar amount for the sum of three broad categories of basic goods and services – food, clothing, and shelter (including utilities)’ (Citro & Michael, 1995, p. 5). The poverty line is then adjusted to take into account the number of persons living in a household, and their age: in 2016, the US poverty line was set at $12,486 for a single person, and at $24,339 for a family of four, with two children under 18.2
By contrast, the main definition of poverty adopted by the European Union (EU) is a relative measure. Individuals are considered as poor when they live in households with an income of less than 60% of the median equivalised disposable household income. This is the standard definition used in British government statistics. The term equivalised means weighting the people living in a household, as children are assumed to cost less than adults. Disposable income refers to income after benefit payments and taxation have been taken into account (Wells, 2016). According to the ONS, median UK household disposable income was £26,300 in 2016. Sixty per cent of this is £15,780.3
Related to the idea of relative poverty is the notion of social exclusion. In the United Kingdom, this view of poverty was pioneered by Peter Townsend in the 1970s. He argued that people are living in poverty when ‘[t]heir resources are so seriously below those commanded by the average individual or family that they are, in effect, excluded from ordinary living patterns, customs and activities’. Access to certain goods and services or resources is essential not for nutritional reasons or with the immediate objective of survival. Instead, they are ‘necessity[ies] of life’ because they are part of ‘life-long customs and [are] psychologically essential’. They are vital to ‘maintaining the threads of social relationships’ (Townsend, 1979, Chapter 1).
Such necessities evolve over time, as society changes. This makes their identification more difficult than stricter calculations of absolute poverty. However, surveys of public opinion indicate that it is possible to identify goods and services at any one moment which members of the public as a whole appear to agree on as being essential ‘needs’ or ‘the necessary minimum for decency’.4 In the United Kingdom, this Breadline Britain methodology was first used in 1983 as part of an ITV television series. Successive surveys conducted in 1990, 1999 and 2012 underline the changing nature of necessities, and the vital importance of goods and services which maintain relationships, such as ‘visiting family or friends in hospital or other institutions’, ‘celebrations on special occasions’, ‘attend weddings, funerals and other such occasions’. It is notable that according to Lansley and Mack, there is a ‘strong consensus across social and income groups, across gender, education levels and ethnicity, about what is necessary to enjoy such a minimum’. Also, surveys indicate that public opinion is more generous towards children than adults (Lansley & Mack, 2015, pp. 16–31). Other things being equal, such widely held values provide a political base for policies to fight poverty.
By definition, relative poverty is also connected to the question of inequality. Reference to a median equivalised income creates a link between how poor households are defined and how ‘most people’ – that is, households grouped around the central level of income in a society – actually live.
Finally, official British statistics also include a measure of absolute poverty. This is a composite approach, because it involves looking at changes in the number of people living below the real value of 60% of the median income in a given base year: 2010 is the current base year. The nominal value of the 60% level for this year is then adjusted for inflation, to provide a real, absolute poverty line which does not automatically follow the evolution of the median income. This makes it easier to demonstrate there have been falls in the poverty rate, providing comfort for existing policies.
Defining Inequality of Income and Wealth
There are usually two standard measures of income inequality. The first is the Gini coefficient and the second compares the median income of the top 10% (decile) or 20% (quintile) of households as a multiple of the bottom decile or quintile. These figures may be given for both original incomes (i.e. salaries and other income, normally from investments, before benefits and taxes), gross incomes (i.e. original income plus cash benefits like pensions, income support and child benefit) or for disposable incomes (i.e. gross income less all direct taxes, including national insurance and local taxes). The difference in equality between the original and disposable income values is substantial. For example, according to the ONS, the original median income for the richest fifth of households was 12 times higher than for the poorest fifth in 2015–2016 (respectively £85,000 and £7000). By contrast, the median disposable income (after benefits and taxes) of the fifth richest households was only five times higher than for the poorest fifth (respectively £62,400 and £12,500) (ONS, 2017b).
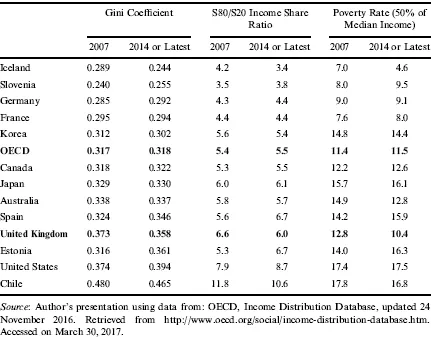
The advantage of these statistics is that they provide a simple way of comparing inequality over time and across countries. But they are very aggregate statistics, and variations in the Gini coefficient often seem minimal even if they actually indicate big differences. The Gini coefficient runs on a scale of 0–1 (or 0% to 100%): 0 indicates a situation of perfect equality between households and 1 (or 100%) a situation of total inequality in which the ‘top 1 per cent’ receives all income. This range may seem large. In practice, however, actual observed Gini coefficients for disposable income within the Organisation of Economic Cooperation and Development (OECD) countries only run from about 0.25 for Scandinavian countries to 0.394 for the United States and 0.46 for Mexico and Chile (see Table 1). This is quite a narrow spread for what we usually view as very different types of societies.
Table 1. Selected Figures on Inequality and Poverty in the OECD Countries.
A similar assessment can be made concerning the data on comparative quintiles. The ratio of the median equivalised disposable income of the top 20% of UK households to the bottom 20% – as calculated by the OECD – was only 6.0 in 2014. This compares with an OECD average of 5.5 and a range running from 3.4 in Iceland to 10.6 in Chile (OECD).5
There are other criticisms of such aggregate measures. At the bottom end of the income distribution, falling or unchanged overall inequality is compatible with worsening absolute living standards for the poorest households. Furthermore, the standard indicator of overall inequality does not say much about the overall distribution of income (see the next chapter by Stewart Lansley). It is wholly compatible with the sustained pulling away from society of top incomes. This top income group – widely identified as the ‘1 per cent’ versus the remaining 99% – is today seeing its income rise far more quickly than the rest of society. In the words of Danny Dorling (2014), ‘[i]n the UK the bottom 99 per cent now have more in common than has been the case for a generation. Some 99 per cent of us are increasingly “all in it together”. It is the top 1 per cent who are not part of this new austerity norm’ (Dorling, 2014, p. 4).
The landmark analysis of capitalism by Thomas Piketty (2013), Capital in the 21st Century, also makes a number of significant points which expand on this observation. Piketty notes rather obviously but unusually that this seemingly small group – the 1% – actually includes quite a large number of adults: 508,000 in the United Kingdom, in 2015.6 He also points out that these populations (the 1%) tend to live in concentrated areas, and are visible in the social landscape as well as ha...