Learn how to build advanced reports and dashboards in Salesforce Lightning experienceAbout This Book• Visualize and create advanced reports and dashboards using Lightning Experience• Improve overall business efficiency with advanced and effective reports and dashboards• Understand and create custom reports and dashboardsWho This Book Is ForThis book is targeted at Salesforce.com administrators, business analysts, and managers who use Salesforce.com for their daily job and want to learn in depth about Salesforce Reporting and Dashboard in Lightning Experience. Readers should have a basic knowledge of Salesforce, such as: Accounts, Contacts, Leads, Opportunities and custom objects.What You Will Learn• Navigate in Salesforce.com within the Lightning Experience user interface• Secure and share your reports and dashboards with other users• Create, manage, and maintain reports using Report Builder• Learn how the report type can affect the report generated• Explore the report and dashboard folder and the sharing model• Create reports with multiple formats and custom report types• Explore various dashboard features in Lightning Experience• Use Salesforce1, including accessing reports and dashboardsIn DetailBuilt on the Salesforce App Cloud, the new Lightning Experience combines the new Lightning Design System, Lightning App Builder, and Lightning Components to enable anyone to quickly and easily create modern enterprise apps.The book will start with a gentle introduction to the basics of Salesforce reports and dashboards. It will also explain how to access reports in depth. Then you will learn how to create and manage reports, to use Schedule Report, and create advanced report configurations. The next section talks about dashboards and will enable you to understand and compare various types of dashboard component and how you can benefit the most from each of them. Then we move on to advanced topics and explain tips and tricks related to reports and dashboards, including reporting snapshots, report parameters, and collaboration.Finally, we will discuss how to access dashboards and reports from the Salesforce1 mobile app.Style and approachThis comprehensive guide covers the advanced features of the all new Salesforce Lightning concepts and communicates them through a practical approach to explore the underlying concepts of how, when, and why to use them.
- 402 pages
- English
- ePUB (mobile friendly)
- Available on iOS & Android
eBook - ePub
Salesforce Lightning Reporting and Dashboards
About this book
Trusted by 375,005 students
Access to over 1.5 million titles for a fair monthly price.
Study more efficiently using our study tools.
Information
Creating and Managing Reports
You learned about the concept of the Salesforce report in Chapter 2, Concepts and Permissions in Reports and Dashboards. We learned how to generate reports from the data source, how data will be shown when a report is generated in Salesforce, how reports are stored in Salesforce, how to share reports with your team or everyone in your organization, and how to acquire the permissions required to work with report. In Chapter 3, Implementing Security in Reports and Dashboards, we learned about how to secure our reports and dashboards.
In this chapter, we will hands-on create reports, discuss more technical details when working with reports, explore what kinds of report you can build in Salesforce, and discover how easy it is to create a new report and maintain existing reports. We will start with multiple types of report format available in Salesforce, why a report format is so important in relation to reports and the benefits and limitations of each format; then we will continue with adding filters to reports.
By the end of this chapter, you will gain knowledge on how to select the correct report format based on the requirements and also learn how to customize the reports using report filters.
Throughout this chapter, we will provide notes and tips to help you to understand important items. The following topics will be covered in this chapter in depth:
- Selecting the report format
- Adding report filters
Selecting the report format
Why is the report format important in creating a report? Each Salesforce report is constructed with a report format, and the report format will determine the report layout, options, and settings for the report. It also determines whether the report can be used as the data source in a dashboard.
There are a few report formats available in Salesforce, from the simple tabular report to the complex matrix and joined report. Each report format has different usages and purposes.
Types of report format
When you create a new report, Tabular is the default report format selected. You will able to modify the report format anytime, even after you save the report, but you may lose some configured items, depending on the original and target report format.
There are four report formats available in Salesforce:
- Tabular
- Summary
- Matrix
- Joined
Let's try to understand each of them individually.
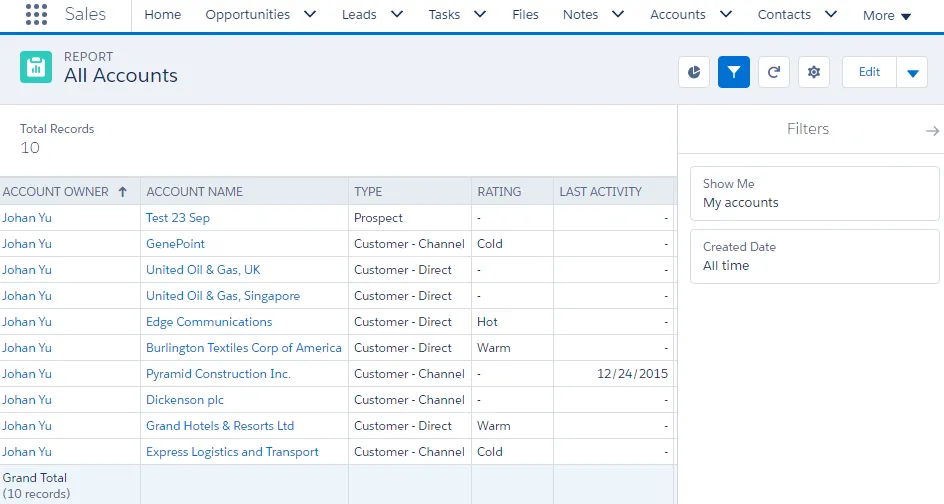
The Tabular report format
The Tabular report is the default report format when you create a new report; this format is considered the simplest; it presents data in a manner similar to that of a spreadsheet. Data will be presented in the row and column format; each row presents one record and each column presents one field, and a column can also be a bucket field or a custom summary formula. The availability of fields for a report depends on the report type used.
We will discuss report types thoroughly in Chapter 5, Understanding Report Types, while bucket field and custom summary formulas will be discussed in Chapter 6, Advanced Report Configuration. For now, the report type will determine the fields available to use in a report; it may have all or some fields from one object or from a few related objects.
Although Tabular is the simplest format, it offers many abilities for you to sort data by columns, adding filters, summarizing fields, adding a bucket field, record count, exporting reports, subscribe report, and so on. All of these features are also true for Summary and Matrix reports. The focus on a Tabular report is on letting you see the details of each record that meets your filter criteria, similar to a spreadsheet.
Let's look at the limitations of the Tabular format:
- No grouping
- No chart
- Not used as the data source for a dashboard unless the Row Limit filter is configured
Other limitations related to the Tabular format are as follows:
- The report builder preview shows a maximum of 50 rows.
- Reports display a maximum of 2,000 rows. To view all the rows, export the report to Excel.
The Tabular report format has the best performance figures when generating reports. Here is a sample of a Tabular report:
Hands-on exercise for creating a Tabular report
Let's consider a use case. We are tasked with showing the first five accounts, sorted by the number of employees in des...
Table of contents
- Title Page
- Copyright
- Credits
- Foreword
- About the Author
- About the Reviewers
- www.PacktPub.com
- Customer Feedback
- Preface
- Fundamentals of Salesforce Reports and Dashboards
- Concepts and Permissions in Reports and Dashboards
- Implementing Security in Reports and Dashboards
- Creating and Managing Reports
- Understanding Report Types
- Advanced Report Configuration
- Adding Charts in Reports and Pages
- Working with Reports
- Building Dashboards in Lightning Experience
- Learning Advanced Dashboard Configuration
- Advanced Tips and Tricks for Reports and Dashboards
- Dashboards and Reports in the Salesforce1 Mobile App
Frequently asked questions
Yes, you can cancel anytime from the Subscription tab in your account settings on the Perlego website. Your subscription will stay active until the end of your current billing period. Learn how to cancel your subscription
No, books cannot be downloaded as external files, such as PDFs, for use outside of Perlego. However, you can download books within the Perlego app for offline reading on mobile or tablet. Learn how to download books offline
Perlego offers two plans: Essential and Complete
- Essential is ideal for learners and professionals who enjoy exploring a wide range of subjects. Access the Essential Library with 800,000+ trusted titles and best-sellers across business, personal growth, and the humanities. Includes unlimited reading time and Standard Read Aloud voice.
- Complete: Perfect for advanced learners and researchers needing full, unrestricted access. Unlock 1.5M+ books across hundreds of subjects, including academic and specialized titles. The Complete Plan also includes advanced features like Premium Read Aloud and Research Assistant.
We are an online textbook subscription service, where you can get access to an entire online library for less than the price of a single book per month. With over 1.5 million books across 990+ topics, we’ve got you covered! Learn about our mission
Look out for the read-aloud symbol on your next book to see if you can listen to it. The read-aloud tool reads text aloud for you, highlighting the text as it is being read. You can pause it, speed it up and slow it down. Learn more about Read Aloud
Yes! You can use the Perlego app on both iOS and Android devices to read anytime, anywhere — even offline. Perfect for commutes or when you’re on the go.
Please note we cannot support devices running on iOS 13 and Android 7 or earlier. Learn more about using the app
Please note we cannot support devices running on iOS 13 and Android 7 or earlier. Learn more about using the app
Yes, you can access Salesforce Lightning Reporting and Dashboards by Johan Yu in PDF and/or ePUB format, as well as other popular books in Computer Science & Cloud Computing. We have over 1.5 million books available in our catalogue for you to explore.