Pattern Analysis and cluster mapping made easyAbout This Book• Analyze patterns, clusters, and spatial relationships using ArcGIS tools• Get up to speed in R programming to create custom tools for analysis• Sift through tons of crime and real estate data and analyze it using the tools built in the bookWho This Book Is ForThis book is for ArcGIS developers who want to perform complex geographic analysis through the use of spatial statistics tools including ArcGIS and R. No knowledge of R is assumed.What You Will Learn• Get to know how to measure geographic distributions• Perform clustering analysis including hot spot and outlier analysis• Conduct data conversion tasks using the Utilities toolset• Understand how to use the tools provided by the Mapping Clusters toolset in the Spatial Statistics Toolbox• Get to grips with the basics of R for performing spatial statistical programming• Create custom ArcGIS tools with R and ArcGIS Bridge• Understand the application of Spatial Statistics tools and the R programming language through case studiesIn DetailSpatial statistics has the potential to provide insight that is not otherwise available through traditional GIS tools. This book is designed to introduce you to the use of spatial statistics so you can solve complex geographic analysis.The book begins by introducing you to the many spatial statistics tools available in ArcGIS. You will learn how to analyze patterns, map clusters, and model spatial relationships with these tools. Further on, you will explore how to extend the spatial statistics tools currently available in ArcGIS, and use the R programming language to create custom tools in ArcGIS through the ArcGIS Bridge using real-world examples.At the end of the book, you will be presented with two exciting case studies where you will be able to practically apply all your learning to analyze and gain insights into real estate data.Style and approachFilled with live examples that you can code along with, this book will show you different methods and techniques to effectively analyze spatial data with ArcGIS and the R language. The exciting case studies at the end will help you immediately put your learning to practice.
- 290 pages
- English
- ePUB (mobile friendly)
- Available on iOS & Android
eBook - ePub
Spatial Analytics with ArcGIS
About this book
Trusted by 375,005 students
Access to over 1.5 million titles for a fair monthly price.
Study more efficiently using our study tools.
Information
Topic
InformaticaSubtopic
Modellazione e design di datiMapping Clusters with ArcGIS Tools
Many things in life naturally tend to cluster. Housing, businesses, trees, and crimes are all examples of clustering. The degree of this clustering is also important. The tools in the Mapping Clusters toolset don't just answer the question "Is there clustering?", but they also answer the question "Where is the clustering?"
The Mapping Clusters tools are helpful in identifying statistically significant hot and cold spots, spatial outliers, as well as locating similar features, and grouping features. This toolset can also be used to define actions that should take place based on the location of clusters. For example, the Mapping Clusters tools can be used to identify areas of high crime activity (burglaries, for example) that can be useful in allocating police officers to deal with this activity in those areas. While these clusters don't typically identify why a phenomena is occurring, they can often provide clues.
The tools in this toolset allow us to visualize the patterns of clustering in our datasets. This is unlike the tools we examined in Chapter 3, Analyzing Patterns with ArcGIS Tools, that gave us a simple Yes or No as an answer to the question of whether our dataset was clustered or dispersed.
In this chapter, you will learn how to use many of these tools, including the following ones, to determine various cluster analyses :
- The Similarity Search tool
- The Grouping Analysis tool
- The Hot Spot Analysis tool
- The Optimized Hot Spot Analysis tool
- The Cluster and Outlier Analysis tool
Using the Similarity Search tool
The Similarity Search tool is used to identify candidate features that are mot similar or most dissimilar to one or more input features by on the attributes of a feature. For input, you select either a layer or a selected subset of a layer. The tool can be used to select most similar, least similar, or both. Dissimilar searches can be equally as important as similarity searches. For example, a community development organization, in its attempts to attract new businesses, might show that their city is dissimilar to other competing cities when comparing crimes.
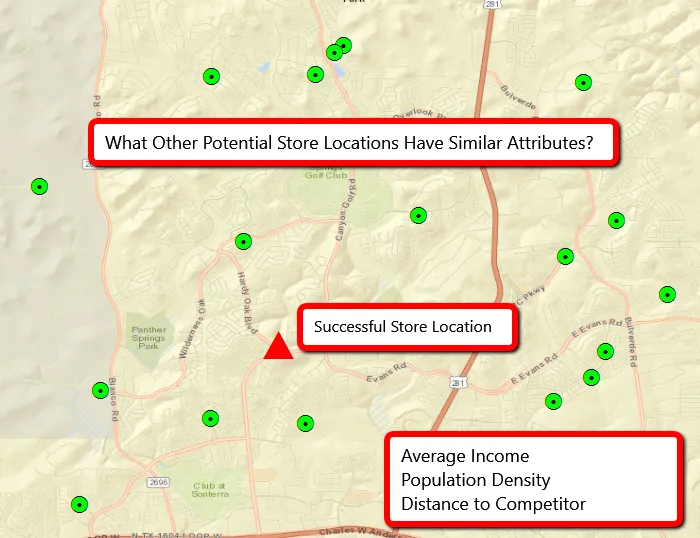
Here is an example of when using the Similarity Search tool would be appropriate. The following screenshot displays a successful store location along with several potential new store locations. This current successful location has a number of attached attributes, including Average Income, Population Density, and Distance to Competitor. A number of possible candidate features are displayed as green points. This layer also includes the same attributes. Using the Similarity Search tool, we can define which of those potential candidate locations is most similar to the successful store location and create a ranking of the potential stores:
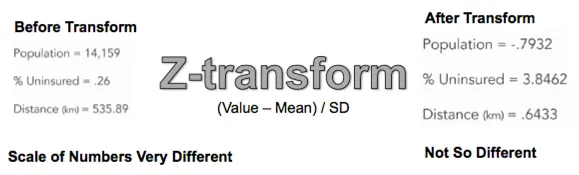
So what does it mean to be similar? How does the tool actually work? The first thing that needs to be done is a standardization of the attributes. Since we're most often working with several attributes in the analysis, we don't want one attribute to overwhelm the others. For example, if you were using population, percent uninsured, and distance to store as the primary attributes, population could easily overwhelm the other attributes because of the size of the numbers. Population numbers tend to be really large, whereas a percentage of uninsured will be less than 1.0. The scale of the numbers is very different. So the tool uses a process called Z-transform to create new values for population, percent uninsured, and distance. The calculation for Z-transform is to subtract the mean from the value and then divide by the standard deviation. This is illustrated in the following screenshot:
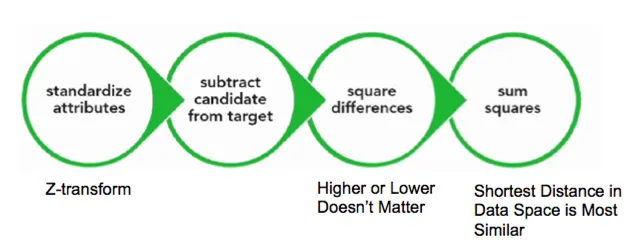
Once the Z-transform has been performed to standardize the attribute, the tool subtracts the candidate values from the target and squares the differences. The differences are squared because we don't want higher or lower values to matter. We just want the actual distance in data space. Finally, the sum of the squares for each of the attributes is calculated and the shortest distance in data space is defined as the most similar:
In this exercise, you'll learn how to use the Similarity Search tool on various demographic attributes.
Preparation
Let's get prepared before we use the Similarity Search tool by performing the following steps:
- In the ArcMap window, open the C:\GeospatialTraining\SpatialStats\DenverDemographics.mxd file. You should see a polygon feature class called Denver_Census_Tracts_Prj, which is a census tracts layer projected to NAD 83 UTM Zone 13.You will need to add a layer called DenverTractHispanicHigh.shp. This layer has already been projected for you, but keep in mind that when you start using your own datasets for analysis, you'll need to project the data into a coordinate system that accurately represents distances. The DenverTractHispanicHigh feature class contains a single polygon feature that represents the census tract in Denver with the highest percentage of Hispanic population (84.78%):

- Open the attribute table for Denver_Census_Tracts_Prj and examine some of the many attribute values. In this exercise, we will use the PCT_HISPAN and RENTED fields to find census tracts that are similar to that provided in the single feature found in the DenverTractHispanicHigh layer in terms of the Hispanic population that rents a home.
Running the Similarity Search tool
Let's run the Similarity Search tool by performing the following steps:
- If necessary, open the ArcToolbox toolbox and find the Spatial Statistics Tools toolbox. Open the toolbox and expand the Mapping Clusters toolset. Double-click on the Similarity Search tool to display the tool. Select the following input parameters:
- Input Features to Match: DenverTractHispanicHigh
- Candidate Features: Denver_Census_Tracts_Prj
- Output Features: C:\Users\<user>\Documents\ArcGIS\Default.gdb\DenverTractHispanicHigh_Simi
- Most or Least Similar: MOST_SIMILAR
- Match Method: ATTRIBUTE_...
Table of contents
- Title Page
- Copyright
- Credits
- About the Author
- About the Reviewer
- www.PacktPub.com
- Customer Feedback
- Preface
- Introduction to Spatial Statistics in ArcGIS and R
- Measuring Geographic Distributions with ArcGIS Tools
- Analyzing Patterns with ArcGIS Tools
- Mapping Clusters with ArcGIS Tools
- Modeling Spatial Relationships with ArcGIS Tools
- Working with the Utilities Toolset
- Introduction to the R Programming Language
- Creating Custom ArcGIS Tools with ArcGIS Bridge and R
- Application of Spatial Statistics to Crime Analysis
- Application of Spatial Statistics to Real Estate Analysis
Frequently asked questions
Yes, you can cancel anytime from the Subscription tab in your account settings on the Perlego website. Your subscription will stay active until the end of your current billing period. Learn how to cancel your subscription
No, books cannot be downloaded as external files, such as PDFs, for use outside of Perlego. However, you can download books within the Perlego app for offline reading on mobile or tablet. Learn how to download books offline
Perlego offers two plans: Essential and Complete
- Essential is ideal for learners and professionals who enjoy exploring a wide range of subjects. Access the Essential Library with 800,000+ trusted titles and best-sellers across business, personal growth, and the humanities. Includes unlimited reading time and Standard Read Aloud voice.
- Complete: Perfect for advanced learners and researchers needing full, unrestricted access. Unlock 1.5M+ books across hundreds of subjects, including academic and specialized titles. The Complete Plan also includes advanced features like Premium Read Aloud and Research Assistant.
We are an online textbook subscription service, where you can get access to an entire online library for less than the price of a single book per month. With over 1.5 million books across 990+ topics, we’ve got you covered! Learn about our mission
Look out for the read-aloud symbol on your next book to see if you can listen to it. The read-aloud tool reads text aloud for you, highlighting the text as it is being read. You can pause it, speed it up and slow it down. Learn more about Read Aloud
Yes! You can use the Perlego app on both iOS and Android devices to read anytime, anywhere — even offline. Perfect for commutes or when you’re on the go.
Please note we cannot support devices running on iOS 13 and Android 7 or earlier. Learn more about using the app
Please note we cannot support devices running on iOS 13 and Android 7 or earlier. Learn more about using the app
Yes, you can access Spatial Analytics with ArcGIS by Eric Pimpler in PDF and/or ePUB format, as well as other popular books in Informatica & Modellazione e design di dati. We have over 1.5 million books available in our catalogue for you to explore.