![]()
1. A Global Warming Science Primer
Earth’s mean surface temperature is doubtlessly warmer than it was 100 years ago. Get over it.
What matters is (1) how much it has warmed, (2) how much of that warming is caused by human activity, and (3) how the relationship between that activity and present temperatures can be translated into a reliable estimate of future warming and its effects.
The temperature changes. But so does the way in which temperature data are processed. We will demonstrate that fact in chapter 2. For now, however, we’ll rely on existing histories.
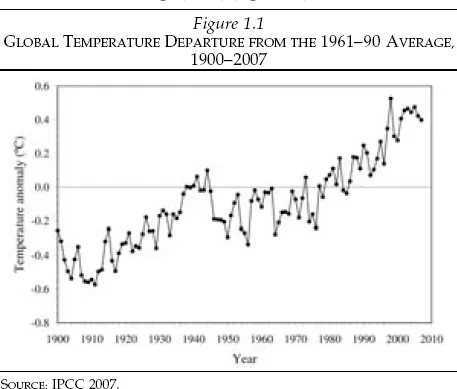
Let’s start out with a standard reference temperature history, the ground-based record from the United Nations’ Intergovernmental Panel on Climate Change (IPCC) (Figure 1.1).
The IPCC history shows two distinct periods of warming, one roughly from 1910 through 1945, and then another that begins rather abruptly in about 1975. Their warming rates are statistically indistinguishable. In the last three decades ending in 2005, the warming rate was 0.178°C ± 0.021°C per decade (0.320°F ± 0.038°F). In the period 1916–45, the rate was 0.151°C ± 0.014°C per decade (0.272°F ± 0.025°F). Each of these is the observed trend plus or minus the statistical margin of error associated with it.
If those figures were the results of a political poll, the pundits would call it a tie—within the poll’s range of error. Similarly, with temperature trends, adding in the “plus” to the first warming and subtracting the “minus” in the second reveals that the rate of warming in recent decades cannot be discriminated from the warming that occurred during a period of similar length in the early 20th century.
Their causes are very likely quite different, however. That said, one thing is for sure: the first warming was associated with a far smaller change in atmospheric carbon dioxide levels than the recent one. After all, we had not added very much carbon dioxide to the atmosphere before World War II.
Modeled vs. Observed Warming
Are recently observed climate changes consistent with computer models of climate change? That depends on where you look. If you examine surface temperatures observed at weather stations or as estimated from satellites, you’ll conclude that the models can provide some quantitative guidance for the future. That doesn’t mean that the models have all the answers, but it does suggest that they are largely sufficient.
There’s another view—namely, that the models may have accurately captured much of the surface temperature change, but that they have missed the vertical dimension. If that’s the case, then the match with surface temperatures is fortuitous—or worse.
Let’s start with the first notion: that the models have something useful to tell us about future warming.
It’s quite easy to demonstrate that the natures of the two periods of warming are quite different—and that the first one was probably caused by changes in the sun, whereas the second one has more of a relationship to human-caused emission of carbon dioxide and other greenhouse gases. We say “more of” because there are still other factors involved, such as a smaller solar effect and changes in land use, such as turning a “naturally” vegetated surface into a farmed one.
Greenhouse-effect warming occurs because certain constituents of our atmosphere, mainly carbon dioxide and water, are molecules whose shape allows them to absorb, and then release, radiation emanating from the earth’s surface.
Bodies give off radiation that is proportional to their temperature. The hotter a body is, the more energetic the energy emitted. The sun, at 6,000°C (10,800°F), emits largely in the visible wavelengths of the universal electromagnetic spectrum (which is why our eyes evolved to “see” sunlight), as well as in the ultraviolet range (the energetic wavelengths that cause sunburn). The much cooler earth (with an average surface temperature of 15°C [27°F]) radiates largely in the less energetic infrared wavelengths (no one gets “earthburn”). Carbon dioxide and water vapor resonate with this low-frequency radiation and absorb some of it. The molecule reaches an unstable, physically “excited” state and then releases the packet of energy either up and out to space, or back down toward the surface. Consequently, greenhouse gases “recycle” the warming radiation of the earth in the lower atmosphere, resulting in a warmer surface and lower atmosphere than there would be in their absence. Another consequence is that the layer above most of the carbon dioxide— the stratosphere—cools because more radiation has been “trapped” below.
The mathematical relationship between the concentration of a greenhouse gas and surface temperature rise has been known for more than a century. The function is logarithmic, which means that the first increments of a greenhouse gas produce the greatest warming, and then increasingly large allotments are required to maintain that rate of warming. You can plot this function on your old graphing calculator or look it up on myriad websites.
Water vapor and carbon dioxide are known to behave quite similarly with regard to potential warming, so they can be (partly) considered to behave as the same greenhouse gas. As a result, atmospheres that are poor in both carbon dioxide and water vapor will respond strongly to the first new increments of either, because of the logarithmic nature of the temperature change. Again, increasingly large amounts of greenhouse gas would be necessary to maintain the same rate of warming.
Plenty of places on earth met this qualification before we put a lot of carbon dioxide in the air. Siberia and northwestern North America in winter are virtually devoid of water vapor: indeed, cold air can hold hardly any before it dumps it onto the ground in the form of frost or snow. It turns out that these are the places that have seen the biggest warming in recent decades. (Note: Antarctica, however, is not warming—a special case described in chapter 4). Further the warming rate in (dry) winter is much greater than it is in (moist) summer, consistent with greenhouse-effect theory.
Carbon dioxide concentrations in our atmosphere were approximately 280 parts per million (ppm) from the end of the last Ice Age to the beginning of the Industrial Revolution. Since then, they have risen to around 385 ppm, or a net increase of about 38 percent. In the 20th century, roughly three-fourths of the increase in atmospheric concentration took place after World War II.
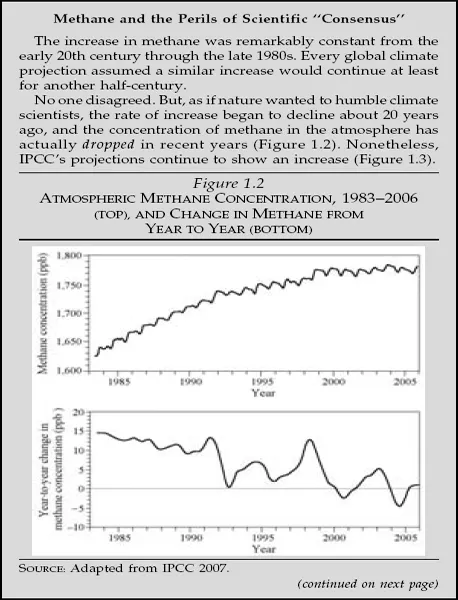
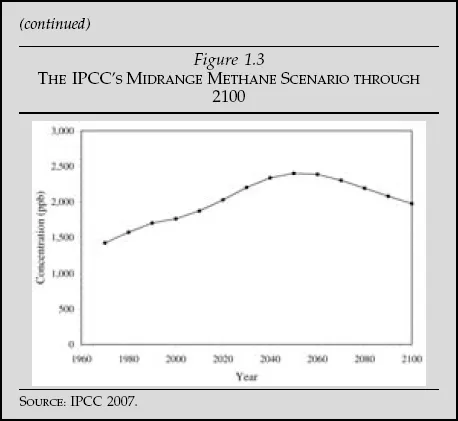
There are several other emissions that alter the transmission of radiation through the atmosphere. On a molecule-for-molecule basis, methane, which is in much lower concentration, is 23 times more efficient at warming the lower atmosphere than is carbon dioxide. Its concentration has increased from about 875 parts per billion (ppb) around 1900, rising linearly to around 1,750 ppb by the 1980s. The increase was thought to have resulted from cow flatulence, coal mining, and leaky gas pipes (mainly in the former Soviet Union). Even so, none of these could possibly explain what happened after the late 1980s (see “Methane and the Perils of Scientific ‘Consensus’”).
Other industrial emissions are thought to counter the warming effect of greenhouse gases. A major cooler is something called sulfate aerosol—a particulate effluent emitted largely from coal-burning power plants. The relative cooling effect of sulfate is only “known” to a very broad range, from no cooling to nearly 2°C (3.6°F), which is very convenient, because it allows modelers to “choose” a value that, when added to the warming effects from carbon dioxide, methane, and a few other minor actors, forces a climate model’s historical output to match the observed record shown in Figure 1.1.
At any rate, carbon dioxide still remains the biggest contributor to warming. A common counterargument is that most of the recent warming is a result of changes in the sun. But “solar” warmings should be a lot different from “greenhouse” ones. Rather than being concentrated only in lower atmosphere, solar warming should be distributed in a way that is more uniform, heating both the lower atmosphere and the stratosphere, in which cooling has been observed in recent decades (see below for other complications!). Nor would a solar warming preferentially warm the winters so much as a greenhouse warming would.
An innovative analysis of U.S. temperatures illustrates the difference between the solar and carbon dioxide-induced warming.
As in the global temperature record (Figure 1.1), there are three distinct modes of behavior in the U.S. temperature history: a period of early-century warming, a midcentury cooling, and a final warming beginning in the 1970s.
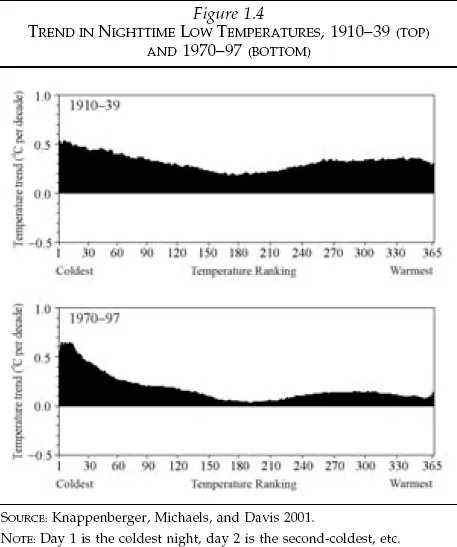
The 365 black bars in each plot in Figure 1.4 are the rates of temperature change on the coldest night of the year (day 1) to the warmest (day 365). Note that these plots are not showing January 1 on the left through December 31 on the right; rather, they are arranging the data from the coldest day in each year to the warmest one. So the left side of each graph shows the trend in the coldest nights of the year, and the right side shows the trend in the hottest nights.
The top of Figure 1.4 is during the warming of the early 20th century (1910–39) and shows very little change in the trend of temperatures from the coldest (left) to the warmest nights (right). The bottom shows for the second warming, 1970 through 1997 (the last year in this particular study). Note how the coldest nights are warming up, much more than any others. This is the way greenhouse warming is supposed to work—and indeed is what has happened.
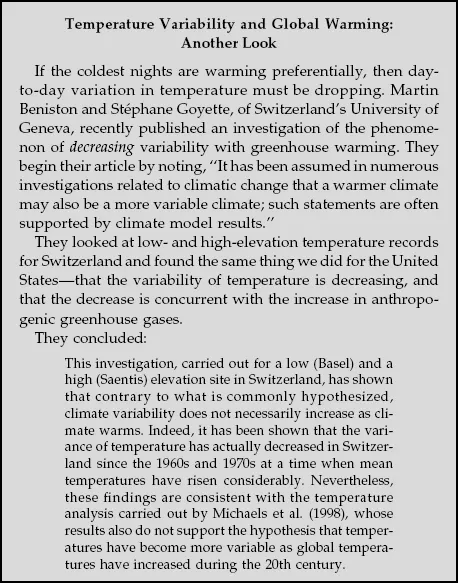
In the recent era, cold nights are warming much more so than hot ones. In other words, temperatures are becoming less variable. (A global examination of this phenomenon was published in our 2000 book, The Satanic Gases. )
We are not saying that the sun has had no influence on recent temperatures, but rather that the solar influence was clearly much greater during the warming of the early 20th century.
Nicola Scafetta and Bruce West, from Duke University, published an interesting paper along these lines in Geophysical Research Letters in 2006. Like many skeptical scientists, they prefer observed relationships to theoretical models. Scafetta and West examined the relationship between cycles in solar variations and cycles in temperatures using data back to the 17th century. Bottom line: “We estimate that the sun contributed as much as 45 percent to 50 percent of the 1900–2000 global warming and 25 percent to 30 percent of the 1980–2000 global warming.”
Do the math. If 25 percent of recent warming is caused by the sun, and 50 percent of total warming since 1900 has the same cause, then 75 percent of the warming of the early 20th century should have had a solar origin. In 2007, using a different solar history and long-term temperature history, Scafetta and West duplicated their 2006 findings.
In sum, you can’t throw the sun out completely when dealing with the recent warming, but it is not a majority contributor. That said, the bigger the solar impact, the smaller the human effect. The more “something else” is causing warming, the less sensitive the climate is to greenhouse emissions.
At any rate, the assumption that the majority of recent warming is from greenhouse changes remains the grounding rock of the notion that the models are providing some useful guidance with regard to 21st-century temperatures.
Because greenhouse gases tend to trap radiation close to the surface, there’s less of a flux through the stratosphere, the layer of the atmosphere that begins about seven miles in altitude in our latitude. The stratosphere should cool slightly at the same time the surface warms. But if the sun gets warmer, so should the stratosphere. In fact, however, there is no record of stratospheric temperature that shows significant recent warming.
Both satellite and weather balloon data show stratospheric cooling, but carbon dioxide is only one cause. Changes in stratospheric composition owing to a slight loss of ozone have also contributed to cooling.
The ozone loss is hypothesized to have been caused by the breakdown of chlorofluorocarbon (CFC) refrigerants. The ban on these, a UN treaty known as the Montreal Protocol, is often cited as an example of successful global environmental regulation. If we managed to regulate CFCs, the reasoning goes, we can do the same for carbon dioxide. In reality the two are hardly analogous. CFCs are one of any number of chemicals that can be used for cooling, so substitutes exist; carbon dioxide, however, is the respiration of our fossil fuel-powered civilization. There is no politically and economically acceptable s...