Cambodia's new national poverty lines show higher historical poverty rates and a dramatic decline in poverty during the 2007-2009 global financial crisis. With 18.9% of the population being poor in 2012, Cambodia now counts among the countries with the most rapid poverty reduction in the world. However, many people moved only slightly above the poverty line---remaining highly vulnerable---and poverty is increasing both in urban areas and according to the international poverty line of $2 per day. this report includes an in-depth look at household debt and vulnerability, the multidimensional nature of poverty, and tools for targeting support to the poor.
- 55 pages
- English
- ePUB (mobile friendly)
- Available on iOS & Android
eBook - ePub
About this book
Trusted by 375,005 students
Access to over 1.5 million titles for a fair monthly price.
Study more efficiently using our study tools.
Information
II A Profile of Income Poverty and Vulnerability
6. Income Poverty. Despite dramatically decreasing income poverty since the mid-2000s, many families have moved only very slightly above the poverty line. The annual Cambodia Socioeconomic Survey (CSES)5 shows that vulnerability to poverty has increased, and that urban poverty may be rising. Inequality has also fallen since 2007. However, a very large share of the population is concentrated toward the bottom of the income distribution, and the poverty rate is highly sensitive to where the line is drawn. Figure 2 illustrates the significant differences that arise from the use of different poverty thresholds. This section uses government, World Bank, and international poverty lines to explore poverty and inequality, and explains why poverty rates fell. We also examine the high debt levels of poorer households, particularly debt taken to finance household consumption.
Figure 2: Where to Draw the Line?
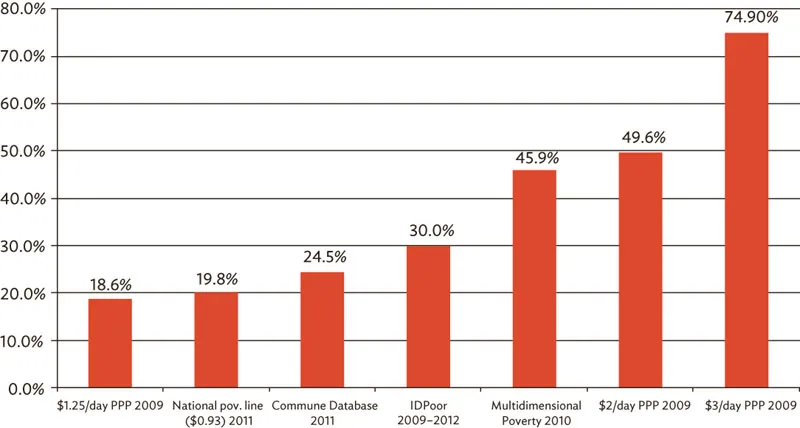
Sources: Ministry of Interior (Commune Database), Ministry of Planning (national poverty line), Oxford Policy and Human Development Initiative (multidimensional poverty), World Bank PovCalNet database (international poverty lines).
The New Official Poverty Lines
7. In 2013, the Ministry of Planning (MOP) introduced new poverty lines and published revised, higher poverty estimates for the years 2004 and 2007, as well as new figures for 2008–2011. In April 2014 MOP published new data for 2012 on its website.6 According to consumption data from the Cambodia Socioeconomic Survey (CSES), the national incidence of poverty fell sharply from 47.8% in 2007 to 18.9% in 2012. Overall poverty reduction was steepest between 2007 and 2009 and tapered off during 2010–2012, although it increased over some periods in urban areas and in Phnom Penh (Figure 3). Regional differences persist. Although poverty was highest in rural areas in 2012, urban poverty has fluctuated. The poverty rate in urban areas excluding Phnom Penh increased significantly from 2010–2011 and was actually higher than in rural areas, before falling again in 2012. In Phnom Penh, poverty increased sharply from 2011 to 2012 reaching 16.3%, and for the first time it was higher compared to other urban areas at 14.5%. In 2012, the poverty rates for Cambodia, Phnom Penh, and rural and other urban areas converged to a greater extent than previously. Currently, they fall within 5.5 percentage points of each other, between 14.5% and 20%. The CSES data cannot be used to calculate reliable poverty headcounts at the provincial level (see Chapter V).
Figure 3: Poverty Trends by Area, 2007–2012
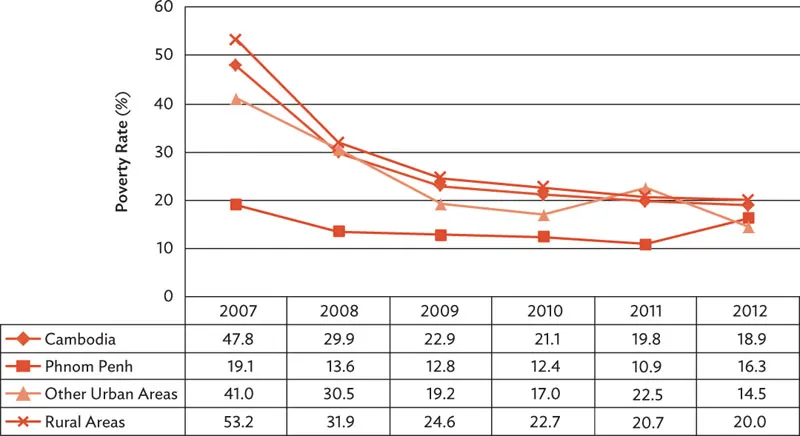
Sources: Ministry of Planning. National Strategic Development Plan 2014–2018. Phnom Penh; Ministry of Planning. 2014. Poverty Estimate in 2012 in Cambodia. General Directorate of Planning, April.
8. The government’s revisions to the poverty lines (Table 1) include (i) a food poverty line based on 2,200 calories per person per day (up from 2,100); (ii) a nonfood component that is estimated separately for Phnom Penh, other urban, and rural areas; (iii) no imputed expenditures (such as for housing); and (iv) a token allowance for the cost of safe water (MOP 2013). The new method remains conservative as it calculates the poverty line from the observed expenditure patterns of only the very poorest families. For example, the composition of the food basket is based on the food consumption of households in the bottom 3 deciles of wealth distribution. The reasoning is that poverty lines should consider the food habits of people living at modest levels (MOP 2013). However, the food habits of the poorest are likely inadequate: the 2010 Cambodia Demographic and Health Survey (CDHS) confirmed that 57% of children in the bottom 2 deciles (the bottom quintile) are stunted (i.e., too short for their age) as a result of chronic malnutrition (World Bank 2012). Reflecting this very low food poverty line, the 2012 food poverty rate was 2.3% overall, 2.3% in rural areas, 2.9% in other urban areas, and 0% in Phnom Penh.
Table 1: Poverty Lines and Rates by Area, 2009
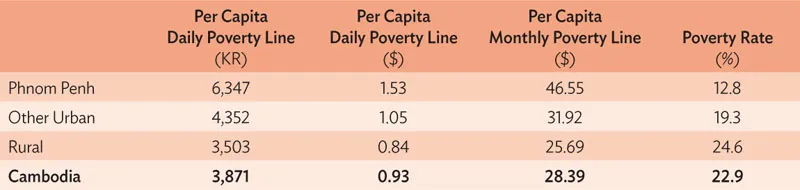
Note: The average exchange rate for 2009 was $1 = KR4,183.
Sources: Ministry of Planning. 2013. Poverty in Cambodia: A New Approach. Phnom Penh: Royal Government of Cambodia; Ministry of Planning. 2009. Cambodia Socioeconomic Survey; and ADB staff calculations.
9. The nonfood component of the poverty line is also determined by looking only at what the poorer households consume. According to the 2009 CSES, the average total per capita consumption in households at the bottom of the wealth distribution was less than $1 per day (in 2009 terms). These households are unlikely to spend an adequate amount on education, health care, housing, sanitation and hygiene, clothing and footwear, and other essentials. Consequently, the overall poverty line will be low.
10. Notably, urban poverty is significantly higher under this new methodology. Using the old approach, the poverty rate in 2009 would have been 1.8% in Phnom Penh and 6.9% in other urban areas, largely due to previously imputed values for rent (even if households did not actually pay rent) and depreciation of household items. Both values artificially inflate total household expenditure (consumption) and yield lower poverty estimates. Therefore, the new poverty measurement methodology more accurately reflects urban poverty. CSES data confirm that urban poverty is rising.
The World Bank Poverty Lines
11. In an independent exercise, the World Bank updated its poverty measurement methodology for Cambodia beginning with the 2009 CSES. The overall approach is broadly similar, with poverty based on consumption. However, some of the technical choices differ slightly, resulting in different poverty lines. While the overall national poverty trends are very similar, particularly from 2009 onward, and both approaches show the most dramatic poverty reduction during 2007–2009 (Figure 4), the national headcounts in 2004 and 2008 differ significantly (by about 10 percentage points). The government’s poverty rate is significantly higher for 2004, and the World Bank’s is significantly higher for 2008.
Figure 4: Comparing Government and World Bank Poverty Estimates, 2004–2011
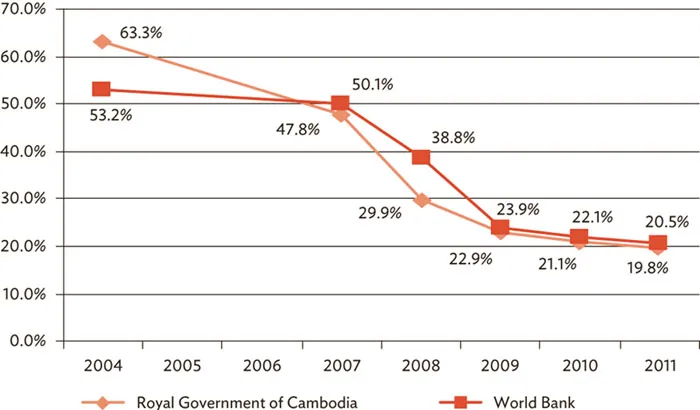
Source: World Bank. 2013. Where Have All the Poor Gone? Cambodia Poverty Assessment 2013. Washington, DC: World Bank.
12. An important difference between the government and World Bank poverty lines is the share of the food component in the overall line. In the official government method, food comprises 49% of the poverty line in Phnom Penh, 60% in other urban areas, and 66% in rural areas, based on expenditure patterns of households in the 3rd decile. In comparison, the World Bank bases the food component on the expenditure patterns of households whose total consumption is within 10% of the food poverty line. Under this approach, food comprises 64% of the poverty line in Phnom Penh and 66% in both rural and other urban areas. In other words, the nonfood component in government poverty lines is larger for Phnom Penh and other urban areas (Table 2).
Table 2: Average Per Capita Food and Nonfood Consumption by Area, 2009
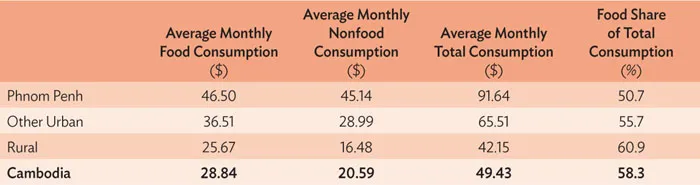
Note: The average exchange rate for 2009 was $1 = KR4,183.
Sources: Ministry of Planning. 2013. Poverty in Cambodia: A New Approach. Phnom Penh: Royal Government of Cambodia; Ministry of Planning. 2009. Cambodia Socioeconomic Survey; and ADB staff calculations.
13. Although the national poverty rates derived from government and World Bank poverty lines are within 1% of each other beginning in 2009, there are important differences in the subnational poverty rates. The World Bank’s rural poverty line is higher, and its urban poverty lines are lower (Table 3). Perhaps most interestingly, the comparison of government and World Bank poverty lines demonstrates that poverty incidence is highly sensitive to the placement of the poverty line. A difference of just 1,021 riels (about $0.25) nearly triples the poverty rate for Phnom Penh, from 4.3% to 12.8%, or about 123,000 people. Even more striking is the difference of 79 riels ($.02) in the poverty line for other urban areas, which changes poverty incidence for other urban areas by 6.6% and strongly supports the case for looking beyond income poverty to more qualitative indicators. A multidimensional approach to poverty measurement is discussed in section 3.
Table 3: Comparing Poverty Lines and Poverty Rates, 2009
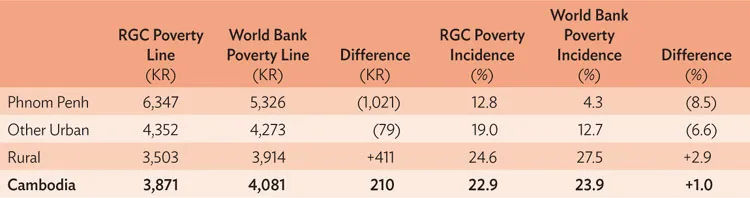
Note: The average exchange rate for 2009 was $1 = KR4,183.
Sources: Ministry of Planning. 2013. Poverty in Cambodia: A New Approach. Phnom Penh: Royal Government of Cambodia; World Bank. 2013. Where Have All the Poor Gone? Cambodia Poverty Assessment 2013. Washington, DC; ADB staff calculations.
14. Who is income-poor? One of the most important determinants of poverty is location. Rural households’ consumption is lower than urban households’ (outside Phnom Penh), which in turn is lower than Phnom Penh households’. Poverty is overwhelmingly concentrated in rural areas, and the gap appears to be growing. In 2004, 89% of poor households lived in rural areas. By 2011, this had increased to 91% (World Bank 2013). Poor households are larger than the national average (5.6 and 4.5 members, respectively), and consumption is lower in households whose working-age adults have fewer years of education. Among poor households, the average years of education has changed very little over time (from 3.1 years in 2004 to 3.3 years in 2011), compared to education in average households (from 3.9 years in 2004 to 5.1 years in 2011). The probability of being poor is higher among ethnic minorities (World Bank 2013).
Gender and Poverty
15. Households headed by women comprised 22% of all Cambodian households in 2012. In 2011, the difference in overall income poverty rates in households headed by women versus households headed by men appeared small (22.5% poor vs. 20.1% poor, respectively) (World Bank 2013). The 2014 ADB study of women’s economic empowerment in Cambodia (forthcoming) recommends further investigation to determine how similar the poverty gap (or depth of poverty) and the determinants of poverty are. Factors that affect per capita consumption include household size and composition, years of education of the household head, and size of landholdings, but these determinants may differ for female- and male-headed households. On average, households headed by women have smaller land holdings than men. Analysis of the 2004 CSES showed that women-led households with more than two children and no adult males were much more likely to be poor and the girls more likely to be working, compared to male-headed households (MOWA 2008).
16. Importantly, the decline in household income poverty rates does not necessarily translate into improved well-being of women and girls unless resources are shared equally within the household. Evidence of high malnutrition and anemia among women and a high incidence of domestic violence indicate women’s inferior position and disadvantaged access to resources.
17. Women-led households are also likely to experience shocks differently than male-headed households, mainly due to social norms and more limited economic opportunities and income. Although women’s participation in the labor force is higher in Cambodia than in neighboring countries, about 70% of employed women are in vulnerable employment (compared to 59% of men), which is defined as the sum of unpaid contributing family workers and own account workers (CSES 2012). Women own 65% of all businesses ...
Table of contents
- Front Cover
- Title Page
- Copyright Page
- Contents
- Tables and Figures
- Currency Equivalents
- Abbreviations
- Acknowledgments
- Foreword
- Executive Summary
- I. Introduction: A Demographic Update
- II. A Profile of Income Poverty and Vulnerability
- III. Non-Income Indicators: The Millennium Development Goals, the Multidimensional Poverty Index, and Subjective Well-Being
- IV. The New National Policy Framework for Poverty Reduction
- V. Tools for Targeting Cambodia’s Poor and Vulnerable
- VI. Implications for the ADB Program in Cambodia
- References
- Back Cover
Frequently asked questions
Yes, you can cancel anytime from the Subscription tab in your account settings on the Perlego website. Your subscription will stay active until the end of your current billing period. Learn how to cancel your subscription
No, books cannot be downloaded as external files, such as PDFs, for use outside of Perlego. However, you can download books within the Perlego app for offline reading on mobile or tablet. Learn how to download books offline
Perlego offers two plans: Essential and Complete
- Essential is ideal for learners and professionals who enjoy exploring a wide range of subjects. Access the Essential Library with 800,000+ trusted titles and best-sellers across business, personal growth, and the humanities. Includes unlimited reading time and Standard Read Aloud voice.
- Complete: Perfect for advanced learners and researchers needing full, unrestricted access. Unlock 1.5M+ books across hundreds of subjects, including academic and specialized titles. The Complete Plan also includes advanced features like Premium Read Aloud and Research Assistant.
We are an online textbook subscription service, where you can get access to an entire online library for less than the price of a single book per month. With over 1.5 million books across 990+ topics, we’ve got you covered! Learn about our mission
Look out for the read-aloud symbol on your next book to see if you can listen to it. The read-aloud tool reads text aloud for you, highlighting the text as it is being read. You can pause it, speed it up and slow it down. Learn more about Read Aloud
Yes! You can use the Perlego app on both iOS and Android devices to read anytime, anywhere — even offline. Perfect for commutes or when you’re on the go.
Please note we cannot support devices running on iOS 13 and Android 7 or earlier. Learn more about using the app
Please note we cannot support devices running on iOS 13 and Android 7 or earlier. Learn more about using the app
Yes, you can access Cambodia by in PDF and/or ePUB format, as well as other popular books in Economics & International Economics. We have over 1.5 million books available in our catalogue for you to explore.