The Pacific is an increasingly urbanized region, with many countries struggling to cope with demands for basic urban services. This publication recommends risk reduction and adaptation measures to promote more sustainable urban development.
- 36 pages
- English
- ePUB (mobile friendly)
- Available on iOS & Android
eBook - ePub
About this book
Trusted by 375,005 students
Access to over 1.5 million titles for a fair monthly price.
Study more efficiently using our study tools.
Information
Building Urban Resilience to Natural Hazards and Climate Change
Building urban resilience to natural hazards and climate extremes in Pacific cities and towns first and foremost requires a move away from current reactive approaches and toward the development and implementation of effective urban planning and management systems to support better urban living standards. To safeguard improvements to urban quality of life, it is critical that natural hazards and climate change risks, such as flooding, earthquakes, drought, and sea-level rise, are considered as an integral part of urban development planning. Similarly, when a natural disaster event does occur, urban resilience supports effective response and post-disaster recovery.
Urban Risk Assessment
Risk assessment involves investigating each of the three elements that contribute to natural hazard and climate change risk: the hazard event, exposure, and vulnerability. This involves identifying potential hazards to which urban areas are exposed and assessing vulnerability of people, property, and infrastructure to these risks.
Satellite imagery, aerial photos, topographic maps, and other spatial data are used to identify the extent to which different areas within an urban zone are exposed to particular natural hazards and climate change hazards. Geographic information system (GIS) tools are useful for assessing exposed elements by depicting the location of critical infrastructure, such as roads, power stations, residential houses, industries, businesses, public buildings, churches, community meeting halls, and infrastructure. GIS tools can combine various sources of data, including the outputs of climate change projections of changes in the frequency, intensity, duration, and spatial distribution of hazards. GIS databases may also contain details about the attributes of various assets such as base elevation of buildings and homes, construction material, and floor size, which can be used for vulnerability assessment, such as determining the extent to which assets can withstand the impact of various hazard events. Similarly socioeconomic data can be used to identify the location of the most vulnerable groups, such as low-income households.
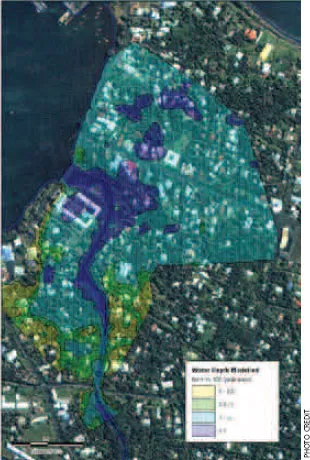
Quantitative methods can be used to determine the probability of occurrence of natural hazard events, and the likely impact of events of different magnitudes in terms damage to infrastructure and other social and economic losses. Deterministic models are also used to develop impact scenarios for various natural hazard or climate change events. Figure 3 presents a flood hazard map that was produced for the lower Vaisigano area of Apia, Samoa for a 1 in 100-year flood event. The figure shows inundation levels for different parts of the catchment area, as well as affected houses, buildings, and other infrastructure.
Figure 3 Flood Hazard Map for Apia, Samoa
Damaged homes in Rita Village, Majuro, Marshall Islands
These spatial tools allow urban planners and managers to visualize various natural hazard and climate change impact scenarios to better understand risks and vulnerabilities within urban areas. This information can then support the development of risk reduction measures such as disaster risk mitigation and climate change adaptation measures as part of the overall urban development planning process. The information will be useful for urban planners for city- and town-level planning, as well as for infrastructure planners, to inform the siting and design of critical infrastructure. Similarly, urban risk information can also benefit the private sector since it can be used to inform the planning and design of commercial, residential, and tourism developments. Post-disaster responses can also be improved if emergency responders have good information on locations that are likely to be most heavily impacted by natural hazard events. Information on “safe” areas within urban centers is also important for emergency service providers when planning for emergency shelters and evacuation routes.
The development of hazard maps requires adequate information on the likely probability, frequency, and magnitude of different hazard events, as well as the location and characteristics of the population and assets at risk. In recent years, hazard models and asset databases have been prepared for Pacific developing member countries under the Pacific Catastrophe Risk Assessment and Financing Initiative, which has allowed for the development of hazard maps for different natural hazard events (Box 2). Similarly, under the Pacific Climate Change Science Program9 supported by the Government of Australia, downscaled climate change projections have been prepared for countries in the Pacific region, and tools such as the Pacific Climate Futures web tool have been developed, which can be used to develop various climate change impact scenarios.10 A regional summary of likely climate change impacts is presented in Table 3.
Table 3 Climate Change Projections for the Pacific Region
Climate Change-Related Event | Projected Trend |
| Extreme rainfall | • Increases in annual mean rainfall near the South Pacific Convergence Zone and Intertropical Convergence Zone • Increase in variability of rainfall • Increased frequency, duration, and intensity of droughts and floods • Widespread increase in the number of heavy and extreme rain days |
| Sea-level rise | • Sea-level rise expected to be between 0.9 meters and 1.6 meters by the end of this century, depending upon current and projected rates of polar ice and glacial melt • Sea-level rise in the Western Pacific at 10 millimeters per year continues through 2030 • For the region overall, total sea-level rise until 2030 similar to the global average (2–3 millimeters per year) |
| Evaporation | • Ratio of annual average rainfall to potential evaporation decreases in most areas (increased aridity) • Smaller changes in potential evaporation near equator due to relatively large projected rainfall increases |
| Extreme high temperature | • Warming over the region of about 0.5°C to 1.0°C by 2030 (70% as large as the global average warming) for all emission scenarios • Greatest regional warming near the equator • Large increases in the incidence of extremely hot days and warm nights. |
| Strong winds and cyclones | • Decrease in surface wind speed in the equatorial and northern parts of the region • Increase in surface wind speed in the south • Overall changes relatively small in most locations • Number of cyclones in the Pacific region to decrease, but the proportion of strong cyclones will increase |
Source: Secretariat of the Pacific Regional Environment Programme. 2013. Climate Change. Sustainable Development Brief. 8 March. Apia, Samoa.
Box 2 Pacific Risk Information System
The Pacific Risk Information System (PacRIS) developed as part of the Pacific Catastrophe Risk Assessment and Financing Initiative, supported by the Asian Development Bank (ADB), Secretariat of the Pacific Community, and the World Bank, contains detailed, country-specific information on assets, population, hazards, and risks. It forms the most comprehensive collection of geo-referenced data for hazard modeling in the Pacific region.
The exposure database leverages remote sensing analyses, field visits, and country-specific datasets to characterize buildings (residential, commercial, and industrial); major infrastructure (such as roads, bridges, airports, and electricity); major crops; and population. More than 500,000 buildings were digitized from very high-resolution satellite images, representing 15% (36% without Papua New Guinea) of the estimated total number of buildings in ADB’s Pacific developing member countries. About 80,000 buildings and major infrastructure were physically inspected. In addition, about 3 million buildings and other assets, mostly in rural areas, were inferred from satellite imagery.
As part of the PacRIS, detailed probabilistic hazard models for all Pacific developing member countries were developed. PacRIS includes the most comprehensive regional historical hazard catalog (115,000 earthquake and 2,500 tropical cyclone events) and historical loss database for major disasters, as well as country-specific hazard models that simulate earthquakes (both ground-shaking and tsunamis) and tropical cyclones (wind, storm surge, and excess rainfall).
PacRIS contains risk maps showing the geographic distribution of potential losses for each Pacific island country as well as other visua...
Table of contents
- Front Cover
- Title Page
- Copyright Page
- Contents
- List of Tables, Figures, and Boxes
- Foreword
- Executive Summary
- Drivers of Urban Disaster Risk in the Pacific
- Building Urban Resilience to Natural Hazards and Climate Change
- Promoting Urban Risk Resilience in the Pacific
- Conclusion
- References
- Glossary of Terms
- Back Cover
Frequently asked questions
Yes, you can cancel anytime from the Subscription tab in your account settings on the Perlego website. Your subscription will stay active until the end of your current billing period. Learn how to cancel your subscription
No, books cannot be downloaded as external files, such as PDFs, for use outside of Perlego. However, you can download books within the Perlego app for offline reading on mobile or tablet. Learn how to download books offline
We are an online textbook subscription service, where you can get access to an entire online library for less than the price of a single book per month. With over 1.5 million books across 990+ topics, we’ve got you covered! Learn about our mission
Look out for the read-aloud symbol on your next book to see if you can listen to it. The read-aloud tool reads text aloud for you, highlighting the text as it is being read. You can pause it, speed it up and slow it down. Learn more about Read Aloud
Yes! You can use the Perlego app on both iOS and Android devices to read anytime, anywhere — even offline. Perfect for commutes or when you’re on the go.
Please note we cannot support devices running on iOS 13 and Android 7 or earlier. Learn more about using the app
Please note we cannot support devices running on iOS 13 and Android 7 or earlier. Learn more about using the app
Yes, you can access Moving from Risk to Resilience by in PDF and/or ePUB format, as well as other popular books in Economics & Environmental Economics. We have over 1.5 million books available in our catalogue for you to explore.