The Key Indicators for Asia and the Pacific 2014, the 45th edition of this series, includes the latest available economic, financial, social, and environmental indicators for the 48 regional members of the Asian Development Bank. It presents the latest key statistics on development issues concerning the economies of Asia and the Pacific to a wide audience, including policy makers, development practitioners, government officials, researchers, students, and the general public. Part I of this issue is a special chapter---Poverty in Asia: A Deeper Look. Parts II and III are composed of brief, nontechnical analyses and statistical tables on the Millennium Development Goals and eight other themes. The publication is supplemented by the fourth edition of the Framework of Inclusive Growth Indicators. The statistical tables in this issue of the Key Indicators may also be downloaded in MS Excel format from http://www.adb.org/publications/key-indicators-asia-and-pacific-2014 or in user-specified format at SDBS Online.
- 352 pages
- English
- ePUB (mobile friendly)
- Available on iOS & Android
eBook - ePub
About this book
Trusted by 375,005 students
Access to over 1.5 million titles for a fair monthly price.
Study more efficiently using our study tools.
Information
PART I–SPECIAL CHAPTER
Poverty in Asia: A Deeper Look
Section 1: Introduction
Asia and the Pacific1 continues to lead the world in reducing extreme poverty.2 The early attainment of the global Millennium Development Goal (MDG) target of cutting extreme poverty in half could not have happened if Asia had been excluded. Should Asia’s growth and poverty trends continue, the region will be free of extreme poverty3 by 2025. Yet many will argue that, for Asia and the Pacific, the $1.25 poverty line is inadequate; it underestimates the minimal costs actually faced by the poor. This special chapter examines several critical aspects that are not captured by the $1.25 poverty line and that could have significant implications for poverty assessment in the region.
In 1981, 1.59 billion Asians were poor—a poverty rate4 of 69.8% (Figure 1.1). In 1990, the number of poor had fallen to 1.48 billion people—or a 54.7% poverty rate. By 2005, Asia had succeeded in halving extreme poverty—its 26.9% rate just below half the 1990 level. That beats the 2015 MDG target deadline by a decade.
Figure 1.1: Poverty in Asia ($1.25 a day poverty line)
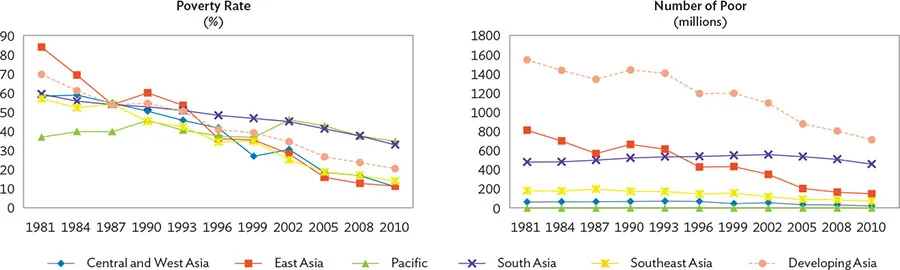
Source: ADB estimates using data from World Bank. Povcalnet: An Online Poverty Analysis Tool. http://iresearch.worldbank.org/PovcalNet/index.htm?0,0 (accessed 28 April 2014).
For the developing world as a whole, the poverty rate fell from 43.1% in 1990 to 25.1% in 2005 and to 20.6% in 2010. This met the MDG global target (Figure 1.2). However, excluding Asia, the extreme poverty rate would have been 24.9% in 1990 and 20.5% in 2010; meaning the rest of the developing world would not be able to halve its 1990 poverty rate until after 2030.
Figure 1.2: Poverty Worldwide and by Region ($1.25 a day poverty line)
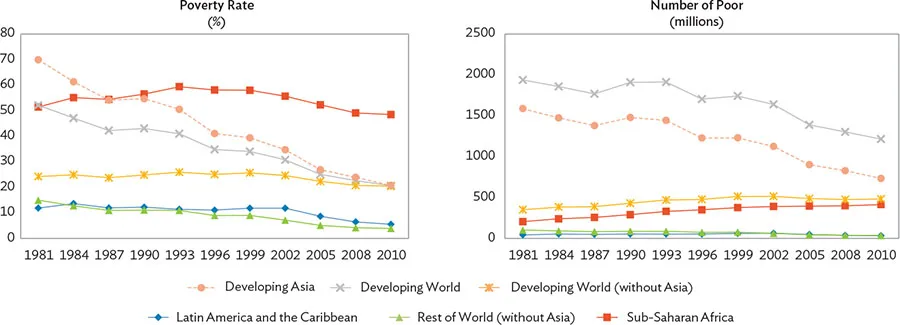
Source: ADB estimates using data from World Bank. Povcalnet: An Online Poverty Analysis Tool. http://iresearch.worldbank.org/PovcalNet/index.htm?0,0 (accessed 28 April 2014).
Box 1.1: Poverty Assessment and Purchasing Power Parities
The International Comparison Program (ICP) provides internationally comparable prices or purchasing power parities (PPPs). For the 2011 round, 199 countries participated and collected price and expenditure data over a large range of final goods and services that make up gross domestic product (GDP).
PPPs are expressed as the ratio of prices in local currency of the same defined products across different counties. Their computation involves three steps: (i) for individual products, price relatives are calculated; (ii) the price relatives under each basic heading are averaged to yield unweighted PPPs; and (iii) the unweighted PPPs are then averaged to obtain final PPPs using expenditure shares of basic headings as weights (World Bank 2014a).
The first $1.08/person/day international poverty line was based on 1993 PPPs and 33 national poverty lines. The $1.25 poverty line was based on 2005 PPPs and 74 national poverty lines. Although the 2011 PPPs were released in May 2014, these will not be used to update the international poverty line until a large number of national poverty lines are updated. The World Bank is reported to have begun the process of updating the international poverty line—which could take some time, judging from past experience.
By magnitude, from 1990 to 2010 the number of extremely poor declined by 745.42 million in Asia—as against 693.47 million globally. This means the number of extremely poor actually increased across the rest of the developing world (by 51.95 million), partly due to population growth. Asia also stands out if the “moderate poverty” line of $2/day/person is used. Between 1990 and 2010, the number of moderately poor declined by 566.31 million in Asia, while increasing by 97.73 million in other regions.
Within Asia, poverty reduction has varied across subregions and by economy. It has done best by far in East Asia—led by the People’s Republic of China (PRC), the world’s most populous country. Over a 20-year period, extreme poverty in East Asia fell from about 60.2% in 1990 to 11.6% in 2010—with the PRC reducing the number of extremely poor by 527.64 million. By contrast, India, the second most populous country, reduced its extremely poor by 48.26 million.
The level of extreme poverty in developing Asia will very likely continue to decline significantly. As presented in Section 5, the extreme poverty rate for the region is projected to decline from 20.7% in 2010 to 12.7% in 2015, 5.8% in 2020 and about 2.5% in 2025. Using World Bank criterion, this means extreme poverty will be technically “eradicated” by 2025. These projections support other studies.5
But this is not the whol...
Table of contents
- Front Cover
- Title Page
- Copyright Page
- Contents
- Foreword
- Acknowledgments
- Statistical Partners
- Guide for Users
- Highlights
- Part I – Special Chapter Poverty in Asia: A Deeper Look
- Part II – Millennium Development Goals Trends and Tables
- Part III – Regional Trends and Tables
- Part IV – Definitions
- Back Cover
Frequently asked questions
Yes, you can cancel anytime from the Subscription tab in your account settings on the Perlego website. Your subscription will stay active until the end of your current billing period. Learn how to cancel your subscription
No, books cannot be downloaded as external files, such as PDFs, for use outside of Perlego. However, you can download books within the Perlego app for offline reading on mobile or tablet. Learn how to download books offline
Perlego offers two plans: Essential and Complete
- Essential is ideal for learners and professionals who enjoy exploring a wide range of subjects. Access the Essential Library with 800,000+ trusted titles and best-sellers across business, personal growth, and the humanities. Includes unlimited reading time and Standard Read Aloud voice.
- Complete: Perfect for advanced learners and researchers needing full, unrestricted access. Unlock 1.5M+ books across hundreds of subjects, including academic and specialized titles. The Complete Plan also includes advanced features like Premium Read Aloud and Research Assistant.
We are an online textbook subscription service, where you can get access to an entire online library for less than the price of a single book per month. With over 1.5 million books across 990+ topics, we’ve got you covered! Learn about our mission
Look out for the read-aloud symbol on your next book to see if you can listen to it. The read-aloud tool reads text aloud for you, highlighting the text as it is being read. You can pause it, speed it up and slow it down. Learn more about Read Aloud
Yes! You can use the Perlego app on both iOS and Android devices to read anytime, anywhere — even offline. Perfect for commutes or when you’re on the go.
Please note we cannot support devices running on iOS 13 and Android 7 or earlier. Learn more about using the app
Please note we cannot support devices running on iOS 13 and Android 7 or earlier. Learn more about using the app
Yes, you can access Key Indicators for Asia and the Pacific 2014 by in PDF and/or ePUB format, as well as other popular books in Economics & International Economics. We have over 1.5 million books available in our catalogue for you to explore.