This regional study includes the People's Republic of China, Japan, the Republic of Korea, and Mongolia and examines how strategies for adapting to climate change up to 2050 can be combined with measures to reduce greenhouse gas emissions in East Asia. Besides discussing climate model results for costs of adaptation in infrastructure, coastal protection, and agriculture, the study estimates costs for sector-specific mitigation options and the total abatement potential for 2020 and 2030. Long-term strategies for addressing the impacts of climate change in East Asia are explored with a focus on the linkages between adaptation and mitigation taking account uncertainty about key climate variables. Finally, it discusses opportunities for enhancing the effectiveness of some critical climate change policies such as regional carbon market.
eBook - ePub
Economics of Climate Change in East Asia
- 214 pages
- English
- ePUB (mobile friendly)
- Available on iOS & Android
eBook - ePub
Economics of Climate Change in East Asia
About this book
Trusted by 375,005 students
Access to over 1.5 million titles for a fair monthly price.
Study more efficiently using our study tools.
Information
Chapter 1
Climate Change Impact on East Asia
Key Messages
• East Asia is a unique region. It is critically important to global mitigation efforts. The region—consisting of about one-quarter of the global population—is responsible for about 30% of the world’s energy-related greenhouse gas emissions, although per capita energy-related emissions in the People’s Republic of China (PRC) and Mongolia are half the Organisation for Economic Co-operation and Development (OECD) average.
• The region has made great strides in reducing the energy intensity of its economies. In the PRC, energy intensity has decreased 55% during 1990–2010; in Mongolia it has decreased 50% over the same period.
• However, per capita emissions have been increasing in the region. Per capita emissions in OECD countries decreased slightly from 10.49 tons of carbon dioxide (CO2) per capita in 1990 to 10.10 tons per capita in 2010. In contrast, the PRC’s per capita emissions almost trebled over the same period, from 1.95 tons of CO2 per capita in 1990 to 5.39 tons per capita in 2010. Similarly, per capita emissions more than doubled in the Republic of Korea, from 5.35 tons of CO2 per capita in 1990 to 11.52 tons per capita in 2010.
• The region is also quite vulnerable to some impacts of climate change, particularly those associated with sea-level rise, cyclones, and flooding. Three cities in East Asia—Guangzhou and Shanghai in the PRC and Osaka/Kobe in Japan—are in the top 10 in the world in terms of current exposed population.
• Countries in East Asia are exposed to a variety of climate-related natural disasters because of their size and location. Cyclones, floods, and droughts cause significant mortality and economic losses. Managing the risks of climate-related natural disasters is already a major concern and will become even more important in future.
• East Asia is warming. Annual mean temperatures have risen across the region since 1970, but there are no clear trends in mean annual precipitation or the number of wet days per year.
• Climate models project a warmer and wetter East Asia. At the country level, global climate models (General Circulation Models [GCMs]) project that by 2050 average temperatures in East Asia will be between 1.9° Celsius (C) (Japan and the Republic of Korea) to 2.6° C (Mongolia) higher than the 1961–1990 baseline using a scenario consistent with recent trends in emissions. Most GCMs project that the region will become wetter by 2050, with the exception of southeastern PRC. By 2100, mean annual precipitation is projected to rise for almost the entire region, with country averages increasing by 44 millimeters (mm) for Mongolia and 97 mm for the Republic of Korea.
Study Area
For the purposes of this study, East Asia consists of the People’s Republic of China (PRC),1 Japan, the Republic of Korea, and Mongolia. It contains the world’s second- and third-largest economies,2 and close to one-quarter of its population.3
The region is unique in that it is a large emitter of greenhouse gases, with critical importance to global mitigation efforts, yet it also may experience some significant climate change impacts. In 2010, the PRC, Japan, and the Republic of Korea ranked in the top 15 countries for total greenhouse gas emissions.4 In 2007, the PRC became the largest source of energy-related emissions,5 and it accounted for almost one-quarter of the global total, although its per capita emissions were only one-third of those of the United States and 25% lower than the overall average for the European Union.6 Coastal areas in East Asia are very prone to the impacts of sea-level rise and increased storm surge that will come with climate change. There are food security concerns in the PRC that could be amplified by climate change. In Mongolia, continued warming may exacerbate existing natural resource concerns, such as a diminution of water resources and desertification, the latter already affecting 78% of the country which is quite dependent on agriculture.7
The PRC dwarfs the other countries in the region, with a land area of more than 9.6 million square kilometers (km2) and a population of 1.34 billion. With a population of just 2.7 million in an area of more than 1.5 million km2, Mongolia has a population density less than half that of the other countries in the group. The PRC and Mongolia have experienced much more rapid gross domestic product (GDP) growth rates early this century than Japan and the Republic of Korea; the PRC, growing at an average annual rate of 10% between 2000–2012, eclipsed Japan as the world’s second-largest economy in the world in 2010 with a GDP of about $8.2 trillion in 2012. The structures of the economies are also quite different. The Japanese and Korean economies are dominated by the service sectors, responsible for 71% of GDP in Japan and 58% in the Republic of Korea; this is typical of mature economies.8 In the PRC, manufacturing remains the largest sector, accounting for 47% of output in 2011. In Mongolia, which has recently experienced a mining boom, agriculture has a declining share of GDP, although it still comprised 15% of the economy in 2011.
Greenhouse Gas Emissions
East Asia is responsible for about 30% of the world’s energy-related emissions
East Asia is an export-oriented industrial powerhouse, heavily dependent on energy-intensive production systems. Thus, in 2010, it produced about 30% of the world’s energy-based CO2 emissions,9 with the PRC the world’s largest emitter at over 7.2 billion tons (24% of the world’s total).10 Concomitant with the rise of the PRC as an economic power, energy-related CO2 emissions increased more than 200% during 1990–2010. Similarly, energy-based CO2 emissions in the Republic of Korea have increased by 145% over the period, while they have changed little in Japan and declined slightly in Mongolia (Table 1). In all four countries, electricity and heat production are the biggest source of energy-related CO2 emissions, and in Mongolia this sector contributes to a majority of the energy-based CO2 emissions. Manufacturing is responsible for a greater percentage of energy-based CO2 emissions in the PRC (33%) than in the rest of the region, while in Japan and the Republic of Korea transport is relatively more important, comprising about 20% of the total energy-based CO2 emissions in each country (Table 2).
Table 1 Total Energy-Related Carbon Dioxide Emissions, 1971–2010 (MtCO2)
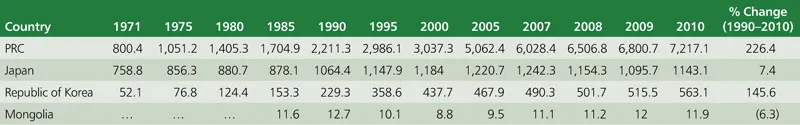
… = not available, MtCO2 = million tons of carbon dioxide, PRC = People’s Republic of China.
Note: Based on the bottom-up, sector approach.
Source: International Energy Agency. 2012. CO2 Emissions from Fuel Combustion. Paris.
Table 2 Sector Breakdown of Energy-Related Carbon Dioxide Emissions in 2010 (MtCO2)
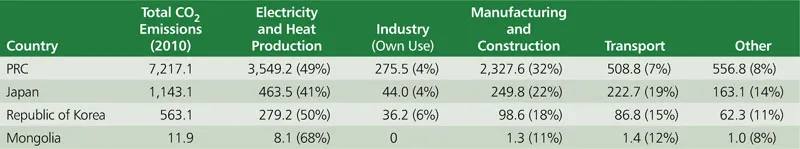
CO2 = carbon dioxide, MtCO2 = million tons of carbon dioxide, PRC = People’s Republic of China.
Note: Figures in parentheses represent percentage of total.
Source: International Energy Agency. 2012. CO2 Emissions from Fuel Combustion. Paris.
Per capita energy-related emissions in the People’s Republic of China and Mongolia are half the Organisation for Economic Co-operation and Development average
In 2010, the Republic of Korea had the highest per capita energy-related CO2 emissions (11.5 tons), closely followed by Japan (8.97 tons)—roughly comparable to the Organisation for Economic Cooperation and Development (OECD) average of 10.10 tons (Table 3). However, per capita energy-related CO2 emissions in the PRC and Mongolia were about half the OECD average, and only slightly more than the world average of 4.4 tons (footnote 10). Per capita energy-related CO2 emissions increased in the PRC (by 176%), the Republic of Korea (by 115%), and Japan (4.2%) during 1990–2010, while per capita emissions decreased in Mongolia.
Table 3 Per Capita Energy-Related Carbon Dioxide Emissions (MtCO2)
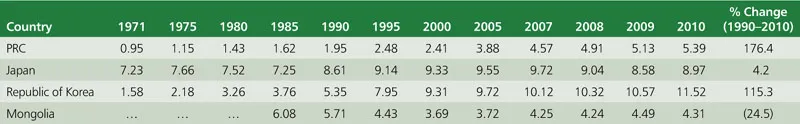
… = not available, ( ) = negative, MtCO2 = million tons of carbon dioxide, PRC = People’s Republic of China.
N...
Table of contents
- Front Cover
- Title Page
- Copyright Page
- Contents
- List of Figures, Tables, and Boxes
- Abbreviations
- Weights and Measures
- Foreword
- Acknowledgments
- Executive Summary
- Introduction
- Chapter 1 Climate Change Impact on East Asia
- Chapter 2 The Economics of Adaptation in the Infrastructure Sector
- Chapter 3 The Economics of Adaptation in the Coastal Sector
- Chapter 4 The Economics of Adaptation in the Agriculture Sector
- Chapter 5 The Impacts of Climate Change on Poverty in East Asia
- Chapter 6 Greenhouse Gas Projections and the Costs of Sector-Specific Mitigation Options
- Chapter 7 Integrated Assessment Modeling in East Asia
- Chapter 8 Climate Policy in East Asia
- Bibliography
- Back Cover
Frequently asked questions
Yes, you can cancel anytime from the Subscription tab in your account settings on the Perlego website. Your subscription will stay active until the end of your current billing period. Learn how to cancel your subscription
No, books cannot be downloaded as external files, such as PDFs, for use outside of Perlego. However, you can download books within the Perlego app for offline reading on mobile or tablet. Learn how to download books offline
We are an online textbook subscription service, where you can get access to an entire online library for less than the price of a single book per month. With over 1.5 million books across 990+ topics, we’ve got you covered! Learn about our mission
Look out for the read-aloud symbol on your next book to see if you can listen to it. The read-aloud tool reads text aloud for you, highlighting the text as it is being read. You can pause it, speed it up and slow it down. Learn more about Read Aloud
Yes! You can use the Perlego app on both iOS and Android devices to read anytime, anywhere — even offline. Perfect for commutes or when you’re on the go.
Please note we cannot support devices running on iOS 13 and Android 7 or earlier. Learn more about using the app
Please note we cannot support devices running on iOS 13 and Android 7 or earlier. Learn more about using the app
Yes, you can access Economics of Climate Change in East Asia by Michael I. Westphal, Gordon A. Hughes, Jörn Brömmelhörster in PDF and/or ePUB format, as well as other popular books in Biological Sciences & Global Warming & Climate Change. We have over 1.5 million books available in our catalogue for you to explore.