Carbon footprint is a tool commonly used to describe the total amount of carbon dioxide and other greenhouse gas emissions for which an individual or organization is responsible. South Asia Department of the Asian Development Bank carried out this study to explore possible approaches and methods to calculate the carbon footprint from its road activities and their total contributions on its overall SARD activities in India. India was selected for this study because it represents all types of SARD activities (highways, national roads, and rural roads) and the project locations range from urban to rural areas with different ecological conditions. A model of calculating carbon footprint---construction, operation, and maintenance---of road projects was developed, and this model was tested and presented using data from its projects in India.
- 31 pages
- English
- ePUB (mobile friendly)
- Available on iOS & Android
eBook - ePub
About this book
Trusted by 375,005 students
Access to over 1.5 million titles for a fair monthly price.
Study more efficiently using our study tools.
Information
FINDINGS
Carbon Footprint of Selected Roads
Carbon Footprint of Construction Phase
The carbon footprint of the construction phase for all sample projects was calculated from primary data collected from the road construction contractors. The direct sources of CO2 emissions during the construction phase include on-site use of diesel, furnace oil, and light diesel oil (LDO) in construction machinery, vehicles, and power generators. The transport of construction materials to the site also contributes to CO2 emissions. The indirect emissions are attributed to the embodied carbon in construction materials and fuels used on-site. Use of vegetation removed from construction site as fuel wood also contributes to direct CO2 emissions.2 Table 4 summarizes the amount of electricity purchased from the grid, diesel used on-site, and the number of trees cut for the four sample projects. Table 5 summarizes the amount of different types of construction materials used per kilometer during construction of the four sample roads, and Table 6 gives the total quantity of diesel used for transporting construction materials and/or fuels to the construction site.
Table 4. Electricity and Fuels Used On-Site and Vegetation Removed
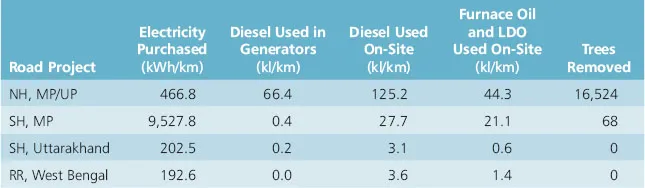
kl = kiloliter, km = kilometer, kWh = kilowatt-hour, LDO = light diesel oil, MP = Madhya Pradesh, NH = national highway, RR = rural road, SH = state highway, UP = Uttar Pradesh.
Note: The electricity purchased per kilometer for the NH, MP/UP construction is less compared with the SH, MP construction because the NH, MP/UP depends on electricity from two sources: grid and diesel generators. Therefore, though it purchases less electricity from the grid, this road project generates its own electricity on-site to meet the construction demand. The diesel used per kilometer of road construction to generate electricity on-site is therefore highest for the NH, MP/UP. SH, MP meets all of its electricity needs by purchasing electricity from the regional grid. Also, the number of trees cut during NH, MP/UP construction is the highest compared with all other roads because this NH passes through forest areas and the construction activity required clearing of a number of trees.
Source: Road construction contractors, project documents, and bills of quantities.
Table 5. Construction Materials Used per Kilometer
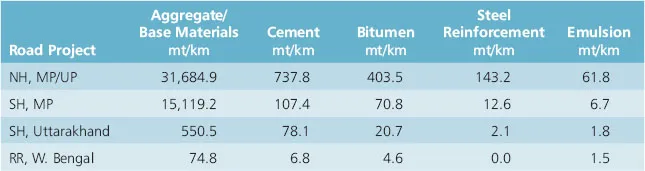
km = kilometer, MP = Madhya Pradesh, mt = metric ton, NH = national highway, RR = rural road, SH = state highway, UP = Uttar Pradesh.
Source: Road construction contractors, project documents, and bills of quantities.
Table 6. Diesel Used for Transportation of Construction Materials/Fuels
| Road Project | Total Diesel Used for Transportation of Construction Materials/Fuels to the Site (kl) |
| NH, MP/UP | 4,331.9 |
| SH, MP | 774.9 |
| SH, Uttarakhand | 148.7 |
| RR, W. Bengal | 60.5 |
kl = kiloliter, MP = Madhya Pradesh, NH = national highway, RR = rural road, SH = state highway, UP = Uttar Pradesh.
Source: Road construction contractors, project documents, and bills of quantities.
The total quantum of fuel and electricity consumed (for road construction and transport of construction materials and/or fuels to the site) was converted to equivalent CO2 emissions using India-specific emission factors. Similarly the embodied CO2 in construction materials and/or fuels used was estimated using India-specific values. The sources for emission factors and embodied energy values are discussed in the appendix. The CO2 estimation results for the construction phase of all sample projects are found in Table 7.
Table 7. CO2 Emissions from the Entire Construction Phase
| Road Project | CO2 (ton/km) |
| NH, MP/UP | 2,115.2 |
| SH, MP | 377.9 |
| SH, Uttarakhand | 109.6 |
| RR, W. Bengal | 48.4 |
CO2 = carbon dioxide, km = kilometer, MP = Madhya Pradesh, NH = national highway, RR = rural road, SH = state highway, UP = Uttar Pradesh.
Source: This study.
Carbon Footprint of Operation Phase
The transport fuels used in vehicles during road operations contribute to direct and indirect CO2 emissions on account of fuel combustion in vehicle engines and embodied carbon in fuels respectively. The cumulative GHG emissions are attributable to the increasing number of vehicles on the road, the number of kilometers traveled by each vehicle, the fuel consumed for each kilometer traveled, and the carbon content of the different fuels used.
Vehicular movement for the entire life period of the sample roads was estimated by using the data from detailed project reports (DPRs) and economic analysis of these sample projects. ADB accepts these vehicular projections in the DPRs for justifying the economic viability of the road construction. Since the road construction activity is based on these future vehicular projections, it is appropriate to use these traffic numbers for the entire project life. The vehicular projections in DPRs include the vehicular growth resulting from population increase and economic growth in the region (natural growth). This natural traffic growth is considered to be the normal growth of traffic that would have taken place with or without the road construction project. In addition to the natural growth of traffic volumes, road improvements also generate new traffic on account of better driving conditions. The projections for this “induced traffic” or “newly generated traffic” due to road improvements and diversion of traffic to these roads are also included in the DPR future traffic projections (sometimes explicitly, sometimes implicitly).
The DPRs of the sample road projects either give yearly projections for different transport modes or the growth rates for these modes. The vehicle projection data and/or growth rates from DPRs were used to derive the vehicle volumes for the design life of sample projects. The operation phase duration or the design life for the sample projects was taken as assumed in the DPRs (for national highway, Madhya Pradesh/Uttar Pradesh – 22 years; state highway, Madhya Pradesh – 30 years; state highway, Uttarakhand – 16 years; and rural road, ...
Table of contents
- Front Cover
- Title Page
- Copyright Page
- Contents
- Foreword
- Abbreviations
- Weights and Measures
- Prologue
- Introduction
- Methodology
- Findings
- Final Notes
- Appendix
- Back Cover
Frequently asked questions
Yes, you can cancel anytime from the Subscription tab in your account settings on the Perlego website. Your subscription will stay active until the end of your current billing period. Learn how to cancel your subscription
No, books cannot be downloaded as external files, such as PDFs, for use outside of Perlego. However, you can download books within the Perlego app for offline reading on mobile or tablet. Learn how to download books offline
Perlego offers two plans: Essential and Complete
- Essential is ideal for learners and professionals who enjoy exploring a wide range of subjects. Access the Essential Library with 800,000+ trusted titles and best-sellers across business, personal growth, and the humanities. Includes unlimited reading time and Standard Read Aloud voice.
- Complete: Perfect for advanced learners and researchers needing full, unrestricted access. Unlock 1.5M+ books across hundreds of subjects, including academic and specialized titles. The Complete Plan also includes advanced features like Premium Read Aloud and Research Assistant.
We are an online textbook subscription service, where you can get access to an entire online library for less than the price of a single book per month. With over 1.5 million books across 990+ topics, we’ve got you covered! Learn about our mission
Look out for the read-aloud symbol on your next book to see if you can listen to it. The read-aloud tool reads text aloud for you, highlighting the text as it is being read. You can pause it, speed it up and slow it down. Learn more about Read Aloud
Yes! You can use the Perlego app on both iOS and Android devices to read anytime, anywhere — even offline. Perfect for commutes or when you’re on the go.
Please note we cannot support devices running on iOS 13 and Android 7 or earlier. Learn more about using the app
Please note we cannot support devices running on iOS 13 and Android 7 or earlier. Learn more about using the app
Yes, you can access Methodology for Estimating Carbon Footprint of Road Projects by in PDF and/or ePUB format, as well as other popular books in Biological Sciences & Global Warming & Climate Change. We have over 1.5 million books available in our catalogue for you to explore.