The question underlying the entirety of this publication is: "How can viable economic corridors be called into existence by dint of government and multilateral support?" The authors answer this question by examining the experience of economic corridor development of different regions from across continents. There are important lessons to be learned for successful corridor development from the experiences of the European Union and South Asia Subregional Economic Cooperation regions. In each case, detailed models were constructed to assess the economic impact of corridor investments. What emerged from a consideration of these two cases (as well as broader discussions) was a framework for evidence-based policy analysis. When key policy makers and stakeholders pursue measurable outcomes for the development of regional economic corridors, the model and data framework (at a standard economic scale of relevance) allows for an investment-relevant development of scenarios, which will be monitored within an effective organizational process. Such a process, with all the elements of an evidence-based policy in place, is highly likely to generate successful economic corridor development, which would realize envisaged opportunities within the regions. Two priority regions in Asia, the Greater Mekong Subregion and the Central Asia Regional Economic Cooperation, face different opportunities.
- 114 pages
- English
- ePUB (mobile friendly)
- Available on iOS & Android
eBook - ePub
About this book
Trusted by 375,005 students
Access to over 1.5 million titles for a fair monthly price.
Study more efficiently using our study tools.
Information
1
How to Make Economic Corridors Work in Asia’s Regions?
Action Plan
Investments in developing economic corridors are increasingly thought to play a key role in the balanced economic development of lagging regions.1 The focus of the workshop was to outline a conceptual frame for thinking about economic corridors and conceptualizing a corridor development business plan through the application of a modeling approach and data framework, which helps prioritize a set of economic corridor investments and policies—those that, in combination, yield the highest economic benefits in geographically balanced distribution. The Asian Development Bank (ADB), under Strategy 2020, its long-term strategic framework, has a mandate to identify new knowledge solutions and pilottest them with the permission and participation of developing member countries (DMCs).2 Further, ADB’s Knowledge Management Directions and Action Plan (2013–2015) encourages the integration of information assets in ADB into a “data library” and initially makes them easily accessible to ADB staff and member countries and later to the public. Following this mandate, this paper will summarize the output of the workshop, and outline a follow-up action plan to:
- build on lessons learned from the European Union (EU) and South Asia Subregional Economic Cooperation (SASEC);
- progress on a framework for evaluating alternative investments for economic corridor development investments; and
- establish suitable organizational processes to meet data requirements and develop and maintain an optimal data resource management system.
With this frame in line, it is opportune to explore opportunities for applying investments to pilot economic corridors (Greater Mekong Subregion (GMS), Central Asia Regional Economic Cooperation (CAREC), and elsewhere). Such a frame is urgently needed in light of two important themes that emerged at the workshop:
- Several criteria are used to justify the funding of corridor projects (such as positive effects on incomes and employment, reductions in poverty and regional disparities, etc.). Subsequently, there is a need to determine if these benefits have materialized and if things are going according to plan. For this, the data needs to permit calculation of indicators that allow us to assess whether the potential and actual impact of corridors are being realized (i.e., in terms of the criteria used to justify the projects).
- The models and data need to be at scales that permit a detailed assessment of the geographic distribution of project benefits and/or costs. The concern about a balanced distribution of benefits is especially pertinent in circumstances where benefits and costs are unevenly spread across borders (whereby some countries find themselves “transit countries,” providing benefits for others but not realizing gains themselves). In the latter situation, the models can be a critical input in devising policies that spread benefits as widely as possible, and so in obtaining buy-in from all countries that are party to an economic corridor.
Lessons Learned (European Union and South Asia Subregional Economic Cooperation)
There are important lessons for successful corridor development to be learned from the experiences of the EU and SASEC regions. In each case, detailed models were constructed to assess the economic impact of corridor investments. The larger regions benefiting from the projects were split up into relatively small subregions for which data was collected and models built. Both also maintained detailed data on the transportation network, and on the effect of new infrastructure investment on the network. The commonalities of these two models suggest the specifications of a core data infrastructure that could support a variety of models that address the central question of corridor investment impact. Such a data infrastructure could support multiple models—the important point is that the appropriate model must be at the scale and level of detail of the EU and SASEC models.
The EU case is a good example of an institutionalized process (spanning decades) for collecting data and building models to evaluate investments and support policy. The SASEC model was also used to prioritize investments, and was at a scale that highlighted the regionally inequitable impact of corridor projects. The model was then used for the design of optimal policy, viz. to examine the possibility of using alternative transit fees for cargo that crosses through a country, to spread the benefits of the project widely.
What emerged from a consideration of these two cases (as well as broader discussions) was a framework for evidence-based policy analysis. This framework is summarized in Figure 1.1. We foresee a decision tool with a “policy view” that takes inputs and provides outputs at a policy-relevant level, using standard indicators and a user-friendly interface. Policy makers would, in particular, be able to specify the scale (regional, national, local) and the model would be able to adjust impact assessments to this choice. The “model view” is the level at which the inner workings of the decision tool are specified (i.e. it contains the equations of the economic model). This is the logical framework within which the effects of changes in policies, whether ex ante or ex post, are calculated. The “data view” makes transparent the data resource management system underlying the model. Clearly, every model will have a corresponding set of data requirements, and the system must satisfy them. Additionally, we specify later a number of additional desirable conditions that would need to be satisfied. Finally, the data resource management system is supported by organizational processes that institutionalize data collection, maintenance, and publishing. These different views constitute a hierarchy where the policy questions drive the analysis, and hence the models. The models, in turn, drive the data requirements, and considerations for building an appropriately rich data resource drive organizational processes.
Figure 1 A Framework for Evidence-Based Policy Analysis
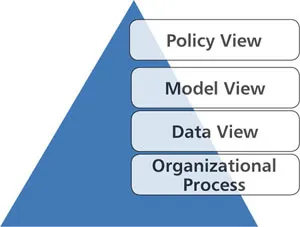
Source: Authors’ own compilation.
Evidence-Based Policy
For successful economic corridor development, implementation of an evidence-based policy framework is needed in a step-by-step plan spanning the next 6 to 18 months. Evidence-based policy requires an ex ante and ex post evaluation of opportunities. To make economic corridors work, four aspects, or views, of evidence-based policy must be implemented together to complement each other for success; policy, modeling, data, and organizational process. The proposed framework has sound theoretical and empirical foundations, yet is focused on the practical task of deciding among alternative projects—and so can provide key input to policy makers. The simulation of investment scenarios can point policy makers to options for balancing a benefit-pay-off matrix across administrative and/or political units of an economic region. The data resource management system can also be used to identify key economic corridor bottlenecks and hurdles for the region’s economic development.
Policy View
There could be multiple indicators and measures of value for public projects (growth rates, outputs of specific industries, incomes in the region, impacts on vulnerable populations, etc.) and of cost (dollar cost of a project, environmental impact, etc.). Policy is implemented on varying scales: there are local, national, and regional policy views. Policy makers represent competing views and interests at these levels. The scale of the policy can dictate its policy view, and policy makers can disagree with each other. Especially at a supranational, regional level, the importance of regional integration in reconciling conflicting policy views is paramount for the success of regional economic integration and economic corridor development. The collective action problem tends to increase with scale.
As an example, let’s take the transport sector in isolation. The value of transportation infrastructure investment lies in its enabling the faster and cheaper movement of goods and people. The first order effect of this is on the delivered prices of goods—goods produced in remote regions can be brought into world markets at more competitive prices (but equally, regions “protected” from competition by bad transportation infrastructure are opened up). The acceleration in transportation is also likely to affect the decisions of people in the region—for instance, in the location of economic activity. Consumption could become further removed in distance from the sources of production, and resources could be repurposed to produce goods for trade.
There are also very important secondary effects that need the attention of policy makers. The most significant secondary effects are likely to arise from the better integration of previously remote locations to economic centers (and hence into the regional and world economy). It is anticipated, in particular, that transport infrastructure investments are complementary to the development of clusters of excellence that can effectively take advantage of agglomeration and scale economies. Negative effects can however, overwhelm positive externalities like agglomeration and scale effects, if a remote region is opened up while it has little if any economic capacity to compete in markets. Then a region can be dominated by ‘transit,’ which depletes its resources and allows emigration of talent. It is desirable that we capture all of these effects, and the framework discussed at the workshop will enable us to do so.
Model View
Models are decision tools for policy makers. To be effective they have to reflect the geographic scale of the decision impact. Decisions can be made based on ex ante simulations of impact scenarios, and on ex post evaluations of previous interventions. To capture change over time, models are dynamic, i.e. they include a time dimension. They are modular and can be extended when demands for new indicators of success emerge.
For instance, the way that production, consumption, and trade patterns are affected by the transport infrastructure will eventually need to be answered using a simulation model in which economic decision-makers (principally producers, consumers, workers, entrepreneurs, and traders) make choices that take into account the costs and benefits of transportation alternatives. The choices include (a) what goods to produce, (b) what goods to consume, (c) what inputs to source and from whom, (d) where to locate production, and (e) what markets to participate in. As mentioned above, the economy would be spatially disaggregated and located in the real geography of the region in question. So we can imagine the local economy of a small subregion, connected via a transportation network with other such subregions, larger economic centers, the region, and the world economy. Details at the level of small administrative areas would allow us to specify how the local economies function, and how they interact with the rest of the world (before and after the intervention). The final fully-calibrated simulation model will capture both spatial and dynamic patterns of economic activity.
Once such a model is developed, we will have a tool that can be used to compare the regional economy before and after the infrastructure investment, and to measure the value of the project. Weighing the costs and benefits, we would be in a position to compare alternative projects to make reasoned recommendations.
Data View
Any project in this area will use and generate extensive data, both to build models to help make policy decisions, and to evaluate the results. For example, data will be needed on population, economic activity, poverty rates, transport accessibility and cost, etc. This data will need to come from a wide range of sources, including national governments, international agencies, and ADB’s own research.
Much of this data is already collected, but is hard to find. Even data collected by existing ADB projects is not held or indexed in a central place, and so can be hard to track down—particularly if one does not know beforehand whether the data exists. There are also cases where data collected for a project or report has later gone missing. Such cases highlight the need for a centralized data catalogue. A pilot for such a registry could be immediately useful if implemented as part of the present data-heavy project.
A data catalogue also presents the opportunity to open currently hard-to-find data for use and scrutiny by other bodies, projects, businesses, and the wider public. Data is a resource, the value of which increases when it is open: it becomes like public infrastructure such as roads that allow a vibrant business environment to function. Data is increasingly becoming a critical input in the founding of new businesses of the information age. By leading the transition to an open data standard (a standard that is already well under way internationally outside Asia) ADB would be making a valuable contribution to the business and governance environment of Asia.
Such a catalogue could collect and make open data from other willing organizations as well as ADB, including national governments, international agencies, etc. In particular governments, to do their work, must collect a large volume of data. In the past this data has been tightly guarded, but in recent years, governments around the world have made more data more openly available. A key element in the process has been the development of open data portals, where national and local governments, as well as other organizations, have implemented their own ...
Table of contents
- Front Cover
- Title Page
- Copyright Page
- Contents
- List of Tables, Figures, and Boxes
- Foreword
- Executive Summary
- Abbreviations
- Program
- Profiles
- Chapter 1: How to Make Economic Corridors Work in Asia’s Regions?
- Chapter 2: Economic Corridors Data Case
- Chapter 3: Case Study on European Union Experience
- Chapter 4: Evaluating Investments in Economic Corridor Development: Lessons from the South Asia Subregional Economic Cooperation Study
- Chapter 5: Future of Global Value Chains in the Greater Mekong Subregion
- Chapter 6: The Greater Mekong Subregion Economic Corridors—Operationalizing Spatial Planning Tools for Environmentally Sound Corridor Investment
- Chapter 7: Central Asia Regional Economic Cooperation Case Study—Bringing the Economic Corridor in from the Cold?
- Back Cover
Frequently asked questions
Yes, you can cancel anytime from the Subscription tab in your account settings on the Perlego website. Your subscription will stay active until the end of your current billing period. Learn how to cancel your subscription
No, books cannot be downloaded as external files, such as PDFs, for use outside of Perlego. However, you can download books within the Perlego app for offline reading on mobile or tablet. Learn how to download books offline
Perlego offers two plans: Essential and Complete
- Essential is ideal for learners and professionals who enjoy exploring a wide range of subjects. Access the Essential Library with 800,000+ trusted titles and best-sellers across business, personal growth, and the humanities. Includes unlimited reading time and Standard Read Aloud voice.
- Complete: Perfect for advanced learners and researchers needing full, unrestricted access. Unlock 1.5M+ books across hundreds of subjects, including academic and specialized titles. The Complete Plan also includes advanced features like Premium Read Aloud and Research Assistant.
We are an online textbook subscription service, where you can get access to an entire online library for less than the price of a single book per month. With over 1.5 million books across 990+ topics, we’ve got you covered! Learn about our mission
Look out for the read-aloud symbol on your next book to see if you can listen to it. The read-aloud tool reads text aloud for you, highlighting the text as it is being read. You can pause it, speed it up and slow it down. Learn more about Read Aloud
Yes! You can use the Perlego app on both iOS and Android devices to read anytime, anywhere — even offline. Perfect for commutes or when you’re on the go.
Please note we cannot support devices running on iOS 13 and Android 7 or earlier. Learn more about using the app
Please note we cannot support devices running on iOS 13 and Android 7 or earlier. Learn more about using the app
Yes, you can access Economic Corridor Development for Inclusive Asian Regional Integration by in PDF and/or ePUB format, as well as other popular books in Economics & Development Economics. We have over 1.5 million books available in our catalogue for you to explore.