Despite economic growth, decreasing fertility rates, and rising education levels, women in Asia are on average 70% less likely than men to be in the labor force, with the country-to-country percentage varying anywhere from 3% to 80%. Results of a new simulation model suggest that closing the gender gap could generate a 30% increase in the per capita income of a hypothetical average Asian economy in one generation. This report discusses the reasons behind the continuing gap in the labor force participation rate between women and men in Asia and the Pacific, the impact of this gap on economic growth, and policy lessons drawn from specific country experiences in the region and elsewhere in the world. The channels of gender inequality are so complex that policy interventions must go beyond economics to effectively address them. Such a multidimensional approach to reducing gender inequality could unleash a nation's full potential for inclusive growth and development.
- 56 pages
- English
- ePUB (mobile friendly)
- Available on iOS & Android
eBook - ePub
About this book
Trusted by 375,005 students
Access to over 1.5 million titles for a fair monthly price.
Study more efficiently using our study tools.
Information
Appendix 1. Performance by Income Group and Placement in the Gender Gap Index
Figure A1.1. Gender Gap Index in Economies in Asia and the Pacific by Income Group The gap between education and health is almost closing, in contrast with the still significant difference in political empowerment and economic access
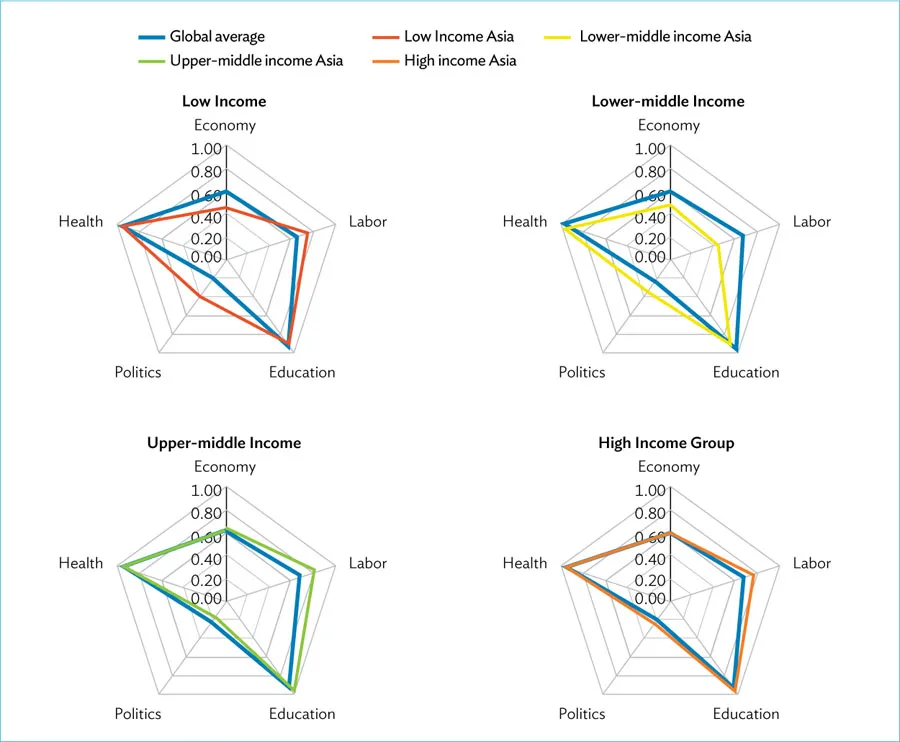
Source: World Economic Forum 2014.
The above figures characterize subindices that comprise the Gender Gap Index of the World Economic Forum.1 Each figure shows the global average for the corresponding income group as well as the average for economies in Asia and the Pacific.2 While the gender gap in education and health has almost closed, this progress contrasts with the still significant difference in political and economic access.
The summary results by income group and subindex are explained below. Table A1.1 shows the countries included classified by income group and Table A1.2 defines each subindex.
Table A1.1. Income Group Classification
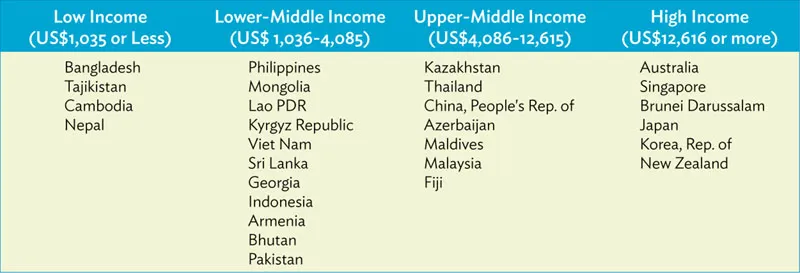
Table A1.2. Structure of Global Gender Gap Index
Subindex |
Variable |
Economic Participation and Opportunity |
• Wage equality between men and women for similar work (converted to female-over-male ratio)
• Ratio: female estimated earned income over male value
• Ratio: female legislators, senior officials and managers over male value
• Ratio: female professional and technical workers over male value |
Labor Force Participation |
• Ratio: female labor force participation over male value |
Educational Attainment |
• Ratio: female literacy rate over male value
• Ratio: female net primary enrolment rate over male value
• Ratio: female net secondary enrolment rate over male value
• Ratio: female gross tertiary enrolment ratio over male value |
Health and Survival |
• Sex ratio at birth (converted to female-over-male ratio)
• Ratio: female healthy life expectancy over male value |
Political Empowerment |
• Ratio: females with seats in parliament over male value
• Ratio: females at ministerial level over male value
• Ratio: number of years of a female head of state (last 50 years) over male value |
Source: World Economic Forum 2014.
Economic Participation and Opportunity subindex. Here the upper-middle income group takes a lead followed closely by high income countries. Because the averages are weighted by population size, the above sample average performance of the upper-middle income group is driven by the high scores of Thailand, the PRC, and Malaysia. The low subindex scores of Pakistan largely affected the poor performance of the lower-middle income group. For the high income group, the subindex scores of Japan and the Republic of Korea contributed to the lowering of the score in economic participation. This is because in both countries, there is a wide gap in estimated income among women and a lower number of women in professional and managerial positions.
Labor Force Participation subindex. In the PRC, the upper-middle income group scored the highest, supported by high rates of mobility and low fertility (Edlund 2015). In Azerbaijan, increased employment in low-wage sectors or self-employment work in agriculture in rural areas contributed to high participation among women (Onder 2013). Kazakhstan, with its high FLFP rate, also contributed to the overall group performance. Among high-income countries, FLFP is lower than the group average for Brunei Darussalam, Japan, and the Republic of Korea. In both Japan and the Republic of Korea, labor market participation among women has been lagging behind other developed economies due to massive exits from labor market after marriage. In these countries, the FLFP rate is M-shaped, characterized by high dropouts in late 20s and early 30s and then by reentry in late 30s due to women’s heavy involvement in childrearing (Kim et al. 2014). In Brunei Darussalam, although the labor force participation among women increased considerably over the years—a development linked to easy access to and the low cost of childrearing services from neighboring countries like Indonesia and Philippines—it is considered relatively low compared to its counterparts in the high income group. Among low income countries, the high female-to-male labor force ratio of Cambodia and Nepal drives the group’s high subindex score. The female labor force of both countries underwent dramatic changes in the past decade although most of their women are involved in agriculture and unpaid family work (Upadhyaya 2000, NIS and ILO 2010). Due to the low scores of highly populated Pakistan, the low-middle income group is trailing behind the other three. There is low FLFP outside the home due to mobility restrictions imposed by men, usually the husbands and fathers, reflecting cultural and religious norms; the situation is aggravated by threat to safety and poor transport facilities (Field and Vyborny 2014).
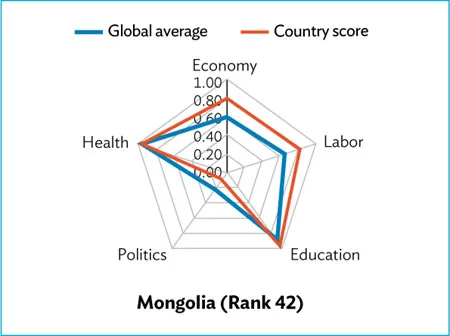
Educational Attainment subindex. In this area, both the high-income and upper-middle-income groups have nearly closed the gap, followed closely by the low-income group; lower-middle-income countries are far behind. Among high-income countries, Australia and New Zealand have closed the gender gap in educational attainment. Brunei Darussalam is among the top-performing countries in tertiary education indicator, with more females than male enrolled in science, technology, engineering, and mathematics studies and also more female PhD graduates. Most countries belonging to the upper-middle-income group posted very high scores on the educational attainment subindex. For the low-income group, Bangladesh is one of the top-performing countries from the region in primary and secondary enrollment indicators. Among the low-middle-income group, the Philippines has closed the educational attainment gap, followed closely in this respect by countries like Armenia, Mongolia, and Sri Lanka; however, the very low score of Pakistan contributed to the group’s very low subindex score on education.
Political Empowerment subindex. The results show that low-income and lower-middle income countries are outdoing high-income and upper-middle-income countries in terms of average scores by income group. Among the low-income group, Bangladesh posted the highest subindex score; this was brought about by a very high score in the indicator for “years with a female head of state;” the country has had 21 years with a female head of state in the past 50 years. Among the lower-middle-income group, the Philippines posted high subindex scores in political empowerment; this is owing to this country having had the highest number of years with a female head of state in the last 50 years. The high-income group obtained a low subindex score in political empowerment due to Brunei Darussalam’s low score, not having had a female head of state in the past 50 years. The same is true for the upper-middle-income group, which scored the lowest in the political empowerment subindex because Azerbaijan, Malaysia, and Maldives have had no female head of state for the last 50 years.
Health and Survival subindex. All income groups have closed over 90% of the health gap. As the averages are weighted by population size, the PRC’s poor performance in the upper-middle income group has driven the result of the group’s weighted average.
1 The Gender Gap Index itself only has four subindices, as the Labor Force participation gap is included in the economic subindex. Here, we have shown the LFPR as a separate index, and the remaining indicators that comprise the economic subindex have been grouped to create the new index.
2 The only Pacific island country included is Fiji.
Appendix 2. Individual Country Results by Global Ranking According to the Gender Gap Index65
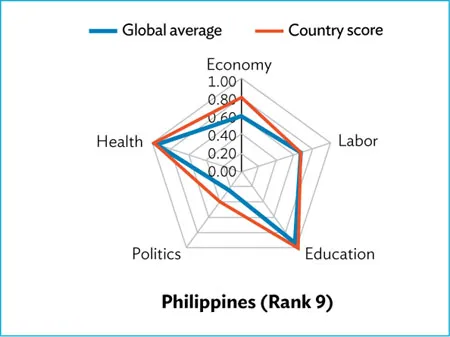
The Philippines is the only country in the Asia and Pacific region that placed in the top ten best-performing countries in the overall index. It is the only country in the region that closed the gap for both the education and health survival subindices, owing to its high female literacy and enrollment rate, survival rate, and life expectancy. In terms of women’s economic advancement, the country has the highest percentage of firms with female participation in ownership as well as a high number of women in legislation and in senior or managerial positions; indeed, for 16 of the last 50 years, it was led by a female head of state. Improvement in women’s labor force participation over the years contributed to the country’s overall index score.
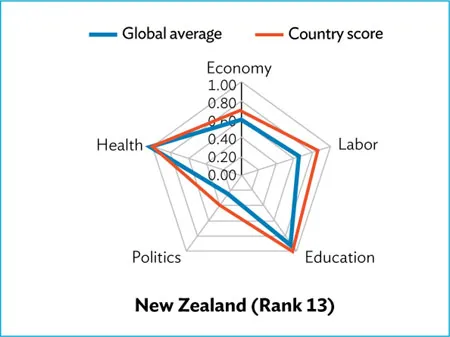
New Zealand has been part of the top ten best-performing countries in the overall index prior to 2014. It has closed the gap in educational attainment with high female literacy and enrollment rates. Female labor force participation is also high, with a higher number of women holding top-level positions. In 1893, New Zealand became the first country where women were granted the right to vote.
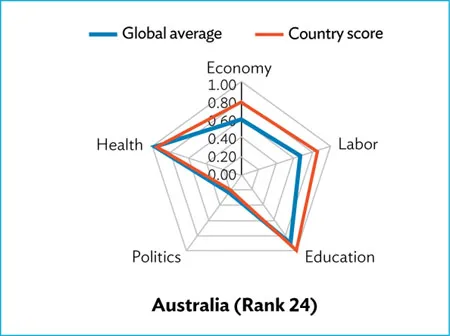
Australia has seen an improvement in its overall index score owing to improvements in the economic participation and opportunity subindex as well as in the political empowerment subindex. It has closed the gender gap in educational attainment and in health and survival.
M...
Table of contents
- Front Cover
- Title Page
- Copyright Page
- Contents
- Foreword
- Highlights
- Figures, Tables, and Boxes
- Abbreviations
- I. Introduction and Global Overview
- II. State of Asia’s Female Labor Force Participation and Economic Growth
- III. The Performance of Selected Asian Countries in Women’s Economic Empowerment
- IV. Major Policy Options and Initiatives to Increase FLFP and Promote Its Growth
- Appendix 1. Performance by Income Group and Placement in the Gender Gap Index
- Appendix 2. Individual Country Results by Global Ranking According to the Gender Gap Index
- References
- Endnotes
- Back Cover
Frequently asked questions
Yes, you can cancel anytime from the Subscription tab in your account settings on the Perlego website. Your subscription will stay active until the end of your current billing period. Learn how to cancel your subscription
No, books cannot be downloaded as external files, such as PDFs, for use outside of Perlego. However, you can download books within the Perlego app for offline reading on mobile or tablet. Learn how to download books offline
Perlego offers two plans: Essential and Complete
- Essential is ideal for learners and professionals who enjoy exploring a wide range of subjects. Access the Essential Library with 800,000+ trusted titles and best-sellers across business, personal growth, and the humanities. Includes unlimited reading time and Standard Read Aloud voice.
- Complete: Perfect for advanced learners and researchers needing full, unrestricted access. Unlock 1.5M+ books across hundreds of subjects, including academic and specialized titles. The Complete Plan also includes advanced features like Premium Read Aloud and Research Assistant.
We are an online textbook subscription service, where you can get access to an entire online library for less than the price of a single book per month. With over 1.5 million books across 990+ topics, we’ve got you covered! Learn about our mission
Look out for the read-aloud symbol on your next book to see if you can listen to it. The read-aloud tool reads text aloud for you, highlighting the text as it is being read. You can pause it, speed it up and slow it down. Learn more about Read Aloud
Yes! You can use the Perlego app on both iOS and Android devices to read anytime, anywhere — even offline. Perfect for commutes or when you’re on the go.
Please note we cannot support devices running on iOS 13 and Android 7 or earlier. Learn more about using the app
Please note we cannot support devices running on iOS 13 and Android 7 or earlier. Learn more about using the app
Yes, you can access Women in the Workforce by in PDF and/or ePUB format, as well as other popular books in Social Sciences & Gender Studies. We have over 1.5 million books available in our catalogue for you to explore.