Energy Statistics in Asia and the Pacific is a compilation of energy supply and demand data of 48 regional members of the Asian Development Bank. The data include the latest 2 years of energy balances of each member as well as historical indigenous energy production, primary energy supply, final energy consumption and power generation from 1990 to 2006. Energy indicators such as energy intensity and energy consumption per capita are also included.
- 433 pages
- English
- ePUB (mobile friendly)
- Available on iOS & Android
eBook - ePub
About this book
Trusted by 375,005 students
Access to over 1.5 million titles for a fair monthly price.
Study more efficiently using our study tools.
Information
PART 1
Introduction
Energy Statistics in Asia and the Pacific (1990-2006) (hereinafter referred to as Energy Statistics) shows the historical energy trends and the latest energy structures of 48 regional members, both the developed and developing members, of the Asian Development Bank (ADB). The Energy Statistics contains energy demand and supply analysis, country energy profiles, and energy balance tables of each member country in the Asia and Pacific region.
Geographical Coverage
The Energy Statistics covers six country groups for the 48 regional members of ADB in Asia and the Pacific. The groups are based on geographical locations for the developing members and one group covering the developed members. The groups are as follows:
a. Central and West Asia: Afghanistan, Armenia, Azerbaijan, Georgia, Kazakhstan, Kyrgyz Republic, Pakistan, Tajikistan, Turkmenistan, and Uzbekistan;
b. East Asia: Hong Kong, China; Republic of Korea; Mongolia; People’s Republic of China (PRC); and Taipei,China;
c. The Pacific: Cook Islands, Fiji Islands, Kiribati, Nauru, Palau, Papua New Guinea, Samoa, Solomon Islands, Timor-Leste, Tonga, and Vanuatu;
d. South Asia: Bangladesh, Bhutan, India, Maldives, Nepal, and Sri Lanka;
e. Southeast Asia: Brunei Darussalam, Cambodia, Indonesia, Lao People’s Democratic Republic (Lao PDR), Malaysia, Myanmar, Philippines, Singapore, Thailand, and Viet Nam; and
f. Developed Group: Australia, Japan, and New Zealand.
Unfortunately, Marshall Islands, Federated States of Micronesia, and Tuvalu were not included in this book due to unavailability of energy data.
The 48 members cover about 25% of the world’s total land area and about 56% of the total population. However, the region contributed only 35% of the world’s gross domestic product (GDP) and consumed only 34% of the world’s total primary energy supply (TPES) in 2006.
Energy Data
This Energy Statistics contains two kinds of energy data tables: (a) Energy Balance Table, and (b) Historical Summary Table.
Energy Balance Table
The energy balance tables of 45 regional members are included in this report. These energy balance tables are based on several sources, including the Asia-Pacific Economic Cooperation (APEC) Energy Database, the International Energy Agency (IEA) Energy Balances of Non-Organisation for Economic and Co-operation and Development (OECD) countries, the United Nations Statistics Division (UNSD) Energy Database, and national energy data. Due to lack of data, some estimation was applied when the APEC and UNSD energy databases were used.
The energy data of the following APEC economies were taken from the APEC Energy Database: Australia; Brunei Darussalam; PRC; Hong Kong, China; Indonesia; Japan; Republic of Korea; Malaysia; New Zealand; Papua New Guinea; Philippines; Singapore; Taipei,China; Thailand; and Viet Nam.
The energy data of the following members were taken from the Energy Balances of Non-OECD countries produced by IEA: Armenia, Azerbaijan, Bangladesh, Cambodia, Georgia, India, Kazakhstan, Kyrgyz Republic, Mongolia, Myanmar, Nepal, Pakistan, Sri Lanka, Tajikistan, Turkmenistan, and Uzbekistan.
The UNSD Energy Statistics Database was the source of the energy data for the following members: Afghanistan, Bhutan, Cook Islands, Fiji Islands, Kiribati, Maldives, Nauru, Palau, Samoa, Solomon Islands, Timor-Leste, Tonga, and Vanuatu.
Lao PDR energy information is based on the consultant’s estimates.
Historical Summary Table
The historical summary table includes some information from the energy balance tables, as well as socioeconomic data, such as GDP at constant 2000 US dollars ($), and population. Several indicators, such as TPES/GDP, are also included.
Each table includes data on
• indigenous production by type of energy;
• primary energy supply by source;
• final energy consumption by sector and type of energy;
• power generation by type of power plant;
• macroeconomic indicators, such as population and GDP at constant 2000 $ values; and
• basic energy indicators, such as
– TPES/capita, total final energy consumption (TFEC)/capita, TPES/GDP, TFEC/GDP;
– import dependency: (net imports – international marine bunkers)/TPES; and
– electricity/capita: power generation/population.
The process to produce the energy balance tables and the historical summary tables is shown in Figure 1.1.
Figure 1.1: Flowchart of the Production of ADB Energy Statistics
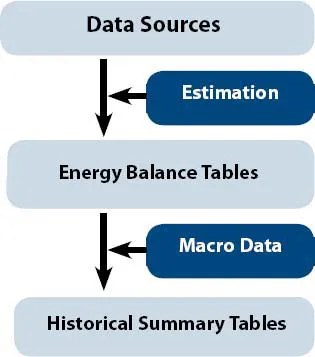
Source: Asia Pacific Energy Research Centre.
The Energy Balance Tables
The energy balance tables have the following characteristics:
• Time coverage: 1990-2006,
• Unit: 1,000 tons of oil equivalent (KTOE), and
• Net calorific value (NCV).
Difference of net coloric value (NCV) from gross calorific value (GCV) by fuel:
• Coal: 0.95 × GCV,
• Oil: 0.95 × GCV, and
• Gas: 0.9 × GCV.
Thermal efficiency
The following thermal efficiencies were applied when converting primary electricity to primary energy:
• Hydro: 100%,
• Nuclear: 33%,
• Geothermal: 10%, and
• Solar photovoltaic (PV), Wind, etc.: 100%
Special Notes
The users of this Energy Statistics should take note of the following:
a. Gaps between the data from 1990 to 2003 and the data from 2004 to 2006
In the APEC Energy Database, the use of a different reporting format from the 2004 data collection resulted in significant gaps in the data from 1990 to 2003 and data from 2004 to 2006, especially in renewable energy for Indonesia; Taipei,China; Thailand; and Viet Nam.
In the APEC Energy Database, the use of a different reporting format from the 2004 data collection resulted in significant gaps in the data from 1990 to 2003 and data from 2004 to 2006, especially in renewable energy for Indonesia; Taipei,China; Thailand; and Viet Nam.
b. Residential and commercial sectors
Before 2003, APEC energy data combined the energy consumption of the residential and commercial sectors into one sector (residential/commercial sector), rather than residential and commercial sectors separately. Some economies, including Brunei Darussalam; PRC; Hong Kong, China; Indonesia; Malaysia; Philippines; Taipei,China; and Thailand, voluntarily submitted energy consumption of the residential and commercial sectors separately.
Before 2003, APEC energy data combined the energy consumption of the residential and commercial sectors into one sector (residential/commercial sector), rather than residential and commercial sectors separately. Some economies, including Brunei Darussalam; PRC; Hong Kong, China; Indonesia; Malaysia; Philippines; Taipei,China; and Thailand, voluntarily submitted energy consumption of the residential and commercial sectors separately.
c. Electricity output by fuel type
Before 2003, in the APEC Energy Database, only the total thermal power generation was reported. Therefore, power generation by fuel type (coal, oil, and gas) from 1990 until 2003 has been estimated based on the IEA energy balances.
Before 2003, in the APEC Energy Database, only the total thermal power generation was reported. Therefore, power generation by fuel type (coal, oil, and gas) from 1990 until 2003 has been estimated based on the IEA energy balances.
PART 2
Overview of Energy Demand and Supply Situation in Asia and the Pacific
2.1 Definition of Energy Products
Part 2 summarizes the energy supply and demand in the Asia and Pacific region using the energy balance tables of regional members. Energy categories used in this chapter are defined as follows:
Coal and coal products
Coking coal, anthracite, other bituminous coal, sub-bituminous coal, lignite, and peat, as well as coal products such as patent fuel, coke oven coke, coal tar, coal briquettes, gas works gas, blast furnace gas, and oxygen steel furnace gas.
Crude oil and petroleum products
Crude oil, natural gas liquids (NGL), refinery feedstock, additives/oxygenates, and other hydrocarbons, as well as petroleum products such as refinery gas, ethane, liquefied petroleum gas (LPG), naphtha, motor gasoline, aviation gasoline, gasoline-type jet fuel, kerosene-type j...
Table of contents
- Front Cover
- Title Page
- Copyright Page
- Preface
- Acknowledgments
- Definitions
- Acronyms and Abbreviations
- Contents
- Part 1. Introduction
- Part 2. Overview of Energy Demand and Supply Situation in Asia and the Pacific
- Part 3. Country/Economy Energy Profiles
- Part 4. Energy Balances and Historical Summary Tables
- Appendix. Definition of Columns and Rows of the Energy Balance Table
- Units and Conversion Factors
- References
- Back Cover
Frequently asked questions
Yes, you can cancel anytime from the Subscription tab in your account settings on the Perlego website. Your subscription will stay active until the end of your current billing period. Learn how to cancel your subscription
No, books cannot be downloaded as external files, such as PDFs, for use outside of Perlego. However, you can download books within the Perlego app for offline reading on mobile or tablet. Learn how to download books offline
Perlego offers two plans: Essential and Complete
- Essential is ideal for learners and professionals who enjoy exploring a wide range of subjects. Access the Essential Library with 800,000+ trusted titles and best-sellers across business, personal growth, and the humanities. Includes unlimited reading time and Standard Read Aloud voice.
- Complete: Perfect for advanced learners and researchers needing full, unrestricted access. Unlock 1.5M+ books across hundreds of subjects, including academic and specialized titles. The Complete Plan also includes advanced features like Premium Read Aloud and Research Assistant.
We are an online textbook subscription service, where you can get access to an entire online library for less than the price of a single book per month. With over 1.5 million books across 990+ topics, we’ve got you covered! Learn about our mission
Look out for the read-aloud symbol on your next book to see if you can listen to it. The read-aloud tool reads text aloud for you, highlighting the text as it is being read. You can pause it, speed it up and slow it down. Learn more about Read Aloud
Yes! You can use the Perlego app on both iOS and Android devices to read anytime, anywhere — even offline. Perfect for commutes or when you’re on the go.
Please note we cannot support devices running on iOS 13 and Android 7 or earlier. Learn more about using the app
Please note we cannot support devices running on iOS 13 and Android 7 or earlier. Learn more about using the app
Yes, you can access Energy Statistics in Asia and the Pacific (1990-2006) by in PDF and/or ePUB format, as well as other popular books in Business & Energy Industry. We have over 1.5 million books available in our catalogue for you to explore.