The Asian Development Review is a professional journal for disseminating the results of economic and development research carried out by staff and resource persons of the Asian Development Bank (ADB). The Review seeks high-quality papers with relevance to policy issues and operational matters done in an empirically-rigorous way. Articles are intended for readership among economists and social scientists in government, private sector, academia, and international organizations. In this issue---Taking Institutions Seriously: Rethinking the Political Economy of Development in the Philippines; Effects of Taxation on Migration: Some Evidence for the ASEAN and APEC Economies; National IQ and National Productivity: The Hive Mind Across Asia; Market Integration in the People's Republic of China; Collective Action, Political Parties, and Pro-Development Public Policy; Infrastructure and Growth in Developing Asia.
eBook - ePub
Asian Development Review
Volume 28, Number 1, 2011
- 176 pages
- English
- ePUB (mobile friendly)
- Available on iOS & Android
eBook - ePub
Asian Development Review
Volume 28, Number 1, 2011
About this book
Trusted by 375,005 students
Access to over 1.5 million titles for a fair monthly price.
Study more efficiently using our study tools.
Information
Infrastructure and Growth in Developing Asia
This paper applies two distinct approaches—growth regressions and growth accounting—to analyze the link between infrastructure, growth, and productivity in developing Asian countries. The main conclusion is that a number of countries in developing Asia have significantly improved their basic infrastructure endowments in the recent past. This improvement appears to correlate significantly with good growth performances. However, the evidence seems to indicate that this is mostly the result of factor accumulation, a direct effect, and that the impact on productivity is rather inconclusive.
JEL classification: H54, N15, O4
I. INFRASTRUCTURE: A REVIEW OF ISSUES
The relevance of infrastructure for development outcomes comes from the fact that it provides both final consumption services to households and key intermediate consumption items for production. Crude estimates from the literature indicate that between one third and one half of infrastructure services are used by households (Prud’Homme 2005, Fay and Morrison 2007), while the rest are utilized by firms.
Infrastructure thus plays an important role in supporting growth and poverty reduction. On the supply side, it supports growth and poverty reduction directly when infrastructure capital stock serves as a production factor, and indirectly, when improved infrastructure promotes technological progress. An increase in the stock of infrastructure capital is argued to have a direct, increasing effect on the productivity of the other factors. It is also believed to generate important externalities across a range of economic activities, which could possibly have a larger net effect than what is expected from a simple factor accumulation effect. These indirect effects could operate through various channels. Among others, these include labor productivity gains resulting from improved information and communication technologies, reductions in time wasted and stress incurred when commuting to work, improvements in health and education, and improvements in economies of scale and scope throughout the economy.
On the demand side, infrastructure facilitates the delivery of services that people need and want—water and sanitation; power for heat, cooking, and light; telephone lines and internet access; and transport. The absence of some of the most basic infrastructure services is an important dimension of what we often mean when we talk about poverty. Increasing the level of infrastructure stock has therefore a direct implication on poverty reduction.
Infrastructure appears significantly related to per capita gross domestic product (GDP) growth in the past decades, mainly through accumulating infrastructure capital stock as a production factor. Yet, the assumed link between infrastructure and growth relies mostly on the assumption that variations of infrastructure services are one of the main drivers of differences in firms’ productivity across regions and countries. The link between the two, however, is not particularly clear from the data. Linking infrastructure services with economic growth or productivity is, therefore, still subject to considerable debate and uncertainty.
There are many ways infrastructure shortcomings translate into productive efficiency losses. For example, access to markets and interactions with potential clients rely on the existence and reliability of the transport and telecommunication networks, and when these fail, firms may suffer from lack of access to market opportunities, higher logistic costs and inventory levels, or information losses (Guasch and Kogan 2001, Li and Li 2008, and Jensen 2007). Similarly, investment and technological choices may be affected by the poor quality of electricity networks, in the sense that frequent power outages and unstable voltage induce high costs and greater risk of machinery breakdown. Growing evidence shows that firms respond by making suboptimal technological choices, by investing in remedial equipment such as power generators, or by deferring other types of investments (Alby, Dethier, and Straub 2011).
The objective of the present paper is twofold. First, it presents a brief update on the state of infrastructure in developing Asian countries. Then it applies two distinct approaches—growth regressions and growth accounting—to analyze the link between infrastructure, growth, and productivity. The paper is organized as follows. Section II provides an overview of past developments in infrastructure capital accumulation in developing Asia. Section III reviews the underlying theory, as well as the existing empirical literature, on the link between infrastructure and growth.1 Section IV presents the results of an empirical investigation of the theoretical effects discussed in Section III. Section V concludes.
II. WHERE DOES DEVELOPING ASIA STAND?
While some developing Asian countries have far better infrastructure than others, overall, the infrastructure in the region remains below the world average. Except for the five relatively advanced economies—Hong Kong, China; the Republic of Korea; Malaysia; Singapore; and Taipei,China (or Asia-5)—the overall quality of infrastructure in developing Asia is largely lagging behind that of industrialized economies (see Figure 1).
Figure 1. Quality of Overall Infrastructure
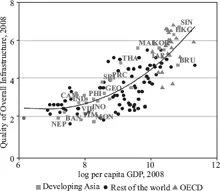
BAN = Bangladesh; BRU = Brunei Darussalam; CAM = Cambodia; GEO = Georgia; HKG = Hong Kong, China; IND = India; INO = Indonesia; KOR = Korea, Rep. of; MAL = Malaysia; MON = Mongolia; NEP = Nepal; PHI = Philippines; PRC = China, People’s Rep. of; SIN = Singapore; SRI = Sri Lanka; TAP = Taipei,China; THA = Thailand; TIM = Democratic Rep. of Timor-Leste; and VIE = Viet Nam. GDP = gross domestic product.
Note:Per capita GDP is based on purchasing power parity in current international dollars. Quality of overall infrastructure refers to assessments of the quality of general infrastructure (e.g., transport, telephony, and energy) in an economy. 1 indicates extremely underdeveloped, while 7 indicates extensive and efficient by international standards. Data cover 132 economies.
Sources: Authors’ calculation using data from World Economic Forum (2005) and International Monetary Fund (2010).
A closer look at different types of infrastructure capital over a longer period reveals a robust but uneven growth across countries and regions over the past years. Electricity generation capacity in developing Asia grew by 4.3 percent annually or more than doubled between 1990 and 2007. But there is a divergence within developing Asia. Central Asia and the Pacific economies were an exception to the rapid growth trend and achieved only marginal growth, if not contraction, during this period. Among the good performers, particularly the Asia-5, capacity growth slowed down by 2000, as the economies matured. Meanwhile some countries with lower per capita income such as Cambodia (since 1995), the People’s Republic of China (PRC), and Viet Nam continued with a robust expansion in generation capacity in the 2000s.
Increase in other infrastructure stocks such as in telecommunication and internet connections has also been significant. Internet users, for example, more than tripled since 2000 or from five users per 100 persons in 2000 to 16 users per 100 persons by 2008. This growth has been largely driven by the Asia-5. However, the current level lags far behind that of Latin American economies with 28 internet users per 100 persons in 2008, a level comparable to the world average.
In the transport sector, the share of paved road to total roads increased from less than half in 1990 to almost 60 percent by mid-2000, though total railroad lines (in kilometers [km]) have shown only modest growth over the same period. But, again, the dispersion is huge across economies with a rapidly growing road subsector. Many of developing Asia’s roads such as in Bangladesh, Cambodia, Mongolia, and Papua New Guinea are hardly paved while almost all roads are paved in Singapore; Hong Kong, China; as well as some economies of the former Soviet Union countries such as Armenia and Kazakhstan.
The rural–urban divide, in terms of access to clean and reliable water supply, is significant. The proportion of the population using an improved drinking water source in 2006, for example, is 90 percent for those living in urban areas as opposed to only 68 percent for those in rural areas. The gap is particularly si...
Table of contents
- Front Cover
- Title Page
- Contents
- Taking Institutions Seriously: Rethinking the Political Economy of Development in the Philippines John V. C. Nye
- Effects of Taxation on Migration: Some Evidence for the ASEAN and APEC Economies Edda Claus and Iris Claus
- National IQ and National Productivity: The Hive Mind Across Asia Garett Jones
- Market Integration in the People’s Republic of China Qingqing Chen, Chor-Ching Goh, Bo Sun, and Lixin Colin Xu
- Collective Action, Political Parties, and Pro-Development Public Policy Philip Keefer
- Infrastructure and Growth in Developing Asia Stéphane Straub and Akiko Terada-Hagiwara
- Back Cover
Frequently asked questions
Yes, you can cancel anytime from the Subscription tab in your account settings on the Perlego website. Your subscription will stay active until the end of your current billing period. Learn how to cancel your subscription
No, books cannot be downloaded as external files, such as PDFs, for use outside of Perlego. However, you can download books within the Perlego app for offline reading on mobile or tablet. Learn how to download books offline
We are an online textbook subscription service, where you can get access to an entire online library for less than the price of a single book per month. With over 1.5 million books across 990+ topics, we’ve got you covered! Learn about our mission
Look out for the read-aloud symbol on your next book to see if you can listen to it. The read-aloud tool reads text aloud for you, highlighting the text as it is being read. You can pause it, speed it up and slow it down. Learn more about Read Aloud
Yes! You can use the Perlego app on both iOS and Android devices to read anytime, anywhere — even offline. Perfect for commutes or when you’re on the go.
Please note we cannot support devices running on iOS 13 and Android 7 or earlier. Learn more about using the app
Please note we cannot support devices running on iOS 13 and Android 7 or earlier. Learn more about using the app
Yes, you can access Asian Development Review by John V. C. Nye, Edda Claus, Iris Claus, Garett Jones, Qingqing Chen, Chor-Ching Goh, Bo Sun, Lixin Colin Xu, Philip Keefer, Stéphane Straub, Akiko Terada-Hagiwara in PDF and/or ePUB format, as well as other popular books in Economics & Development Economics. We have over 1.5 million books available in our catalogue for you to explore.