Climate change and the resulting rise in sea level would affect water sector infrastructure, such as surface water supply and urban drainage systems. The climate resilience of such infrastructure should then be made more climate-resilient to optimize its expected benefits. This publication provides a specific example of assessing the impacts of climate change on the water sector infrastructure in Khulna, Bangladesh, by developing the climate change and socioeconomic development scenarios for 2030 and 2050, and running mathematical models to obtain the level of salinity in river water---where the proposed intake for water supply is located---and the extent of waterlogging in the city. The study then identifies and makes a financial evaluation on adaptation options to cope with the impacts. While various uncertainties still remain, the proposed investments would be made more climate-resilient by incorporating adaptation options into the project design.
- 38 pages
- English
- ePUB (mobile friendly)
- Available on iOS & Android
eBook - ePub
About this book
Trusted by 375,005 students
Access to over 1.5 million titles for a fair monthly price.
Study more efficiently using our study tools.
Information
Study Approach and Methodology
To assess climate change risks and impacts for Khulna, the study (i) made climate change projections for Khulna for 2030 and 2050; (ii) developed socioeconomic development scenarios for Khulna for 2030 and 2050; (iii) developed and calibrated three mathematical models; (iv) ran the models for 2030 and 2050, using the climate and socioeconomic changes projected; (v) assessed impacts through geographic information system mapping; and (vi) identified and analyzed adaptation options. A flow diagram showing this approach and work flow is in Figure 3.
Figure 3 Flow Diagram of the Study
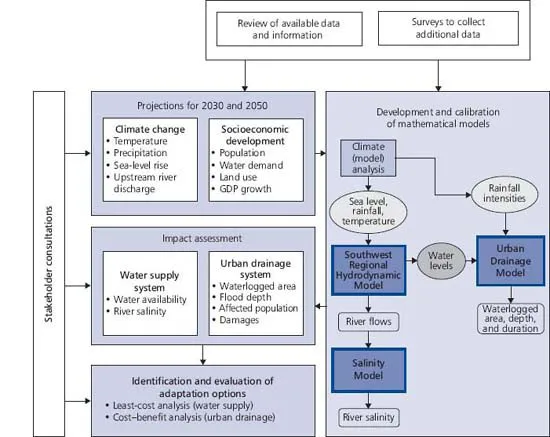
GDP = gross domestic product.
Source: Adapted from ADB.
Climate Change Projection
Climate
Two greenhouse gas emission scenarios, A2 and B1, from the Special Report on Emissions Scenarios by the Intergovernmental Panel on Climate Change (IPCC) were used because they represent the high and low brackets of the estimated global temperature increases under the report story lines.9 A2 is the business-as-usual scenario, a very heterogeneous, market-led world, with high population growth, slow economic development, and slow technological change. B1, however, is the sustainable development scenario, a convergent world with rapid changes in economic structures toward a service and information economy, with resulting lower greenhouse gas emissions.
Statistical downscaling was then undertaken from a Global Climate Model (ECHAM5/MPI-OM)10 to a finer resolution (0.5° x 0.5°), mainly because of the time available for the study. The model outputs were bias-corrected for rainfall and temperature.11 The findings are outlined in Table 1.
Table 1 Summary Features of Climate Projections for Khulna
Scenario | A2 | B1 |
Temperature | The average monthly temperature rise by 2050 varies from +0.5°C in October to +1.7°C in January and February. | The average monthly temperature rise by 2050 varies from +0.5°C in June, July, and August to +1.5°C in February and April. |
Rainfall | The annual rainfall increases by about 5.0% by 2050 (1,860 mm per year) from the reference period.a | The annual rainfall increases by about 9.3% by 2050 (1,739 mm per year) from the reference period.b |
Seasonal rainfall | Increase in July-September by 4.6% and a decrease in December-February by 26.3% | Increase in July-September by 10.5% and a decrease in December-February by 46.2%.c |
Rainfall intensity | 50 mm or more rainfall in 6 hours increases from 4.20 times per year to 5.90 times per year in 2050. | 50 mm or more rainfall in 6 hours marginally increases from 4.20 times per year to 4.25 times per year in 2050. |
C = Celsius, mm = millimeter.
a The value is compared with 1,769 mm, the average annual rainfall from 2001 to 2020 projected in the model under the A2 scenario, and thus is different from the observed value (1,924 mm from 2004 to 2009) in the past. The observed value is higher than the projected value. The historical observed average between 1985 and 2009 is 1,887 mm.
b The value is compared with 1,591 mm, the average annual rainfall from 2001 to 2020 projected in the model under the B1 scenario, a much lower figure than the observed value.
c A higher degree of increase and decrease under the B1 scenario in comparison to that under the A2 scenario is different from what one normally expects. Due to the interannual and decadal variability and chaotic nature of atmospheric process, individual model runs can result in different changes in rainfall. Therefore, these differences are considered within the margin of error and do not necessarily mean that there will be higher variation under the B1 scenario.
Source: Adapted from ADB.
These results are, however, based on the outcomes of a single Global Climate Model. Other models indicate similar changes, but there are still considerable uncertainties about the possible change in rainfall in Bangladesh.
Sea-Level Rise
As for the rising sea levels, two different levels (i.e., plausible high and plausible low) were used in the different model runs, due to high uncertainty of the levels. The plausible-low scenarios, 10 centimeters (cm) in 2030 and 20 cm in 2050, are about midrange in the IPCC scenarios. The plausible-high scenarios, 25 cm in 2030 and 40 cm in 2050, assume significant melting of land ice. This is in line with the findings of recent new models and research, which indicate that the contribution of melting land ice to rising sea levels may be substantially more than what IPCC projected (footnote 9).
River Discharge
Another important factor is the intake discharge of the Gorai and Arial Khan rivers from the Ganges and Padma rivers, respectively. As it was not possible in the study to develop a hydrological model for the complete Ganges and Brahmaputra basins to determine future discharge rates, the output of the same Global Climate Model (ECHAM5/MPI-OM) on the runoff changes of the Ganges and Brahmaputra basins was used. Under both the A2 and B1 scenarios, the intake discharge of the Gorai and Arial Khan rivers is reduced in 2030 and 2050 during most of each year, except in October (i.e., the end of the rainy season) when the discharge is increased.
Socioeconomic Scenario Development
For the study, numerous assumptions were made regarding Khulna’s socioeconomic scenarios in 2030 and 2050. Socioeconomic surveys, various census data, literature reviews, and discussions with relevant agencies and experts were the basis of scenario development. Key parameters are shown in Table 2.
Table 2 Key Parameters for Socioeconomic Development
Parameter | Assumption | Remarks |
Population in KCC area | 2% growth per year: (i) 976,000 in 2010; (ii) 1,450,000 in 2030; and (iii) 2,155,000 in 2050 | Population distribution among the 31 wards was assumed to be maintained. |
Water demand | Per capita domestic demand of 120 liters per day in 2030 and 150 liters per day in 2050 | 100% of the population in the KCC area will be served by the proposed water supply system. |
GDP growth rate | 6.2% per year | The national average rate of growth between 2001 and 2009 was 6.2%. |
Urban development | Proportion of impervious areas (weighted average): (i) 17.7% in 2010, (ii) 29.0% in 2030, and (iii) 38.7% in 2050 | For each subcatchment area, a change in the proportion between pervious and impervious areas was projected. |
GDP = gross domestic product, KCC = Khulna City Corporation.
Source: Adapted from ADB.
Hydraulic Models Development
Three mathematical models were developed and/or calibrated to assess the impacts of climate change for the study. The roles of these models—the Southwest Regional Hydrodynamic Model, Salinity Model, and Urban Drainage Model—are shown in Figure 4, and the main features of each model are given in Table 3.
Figure 4 Model Framework
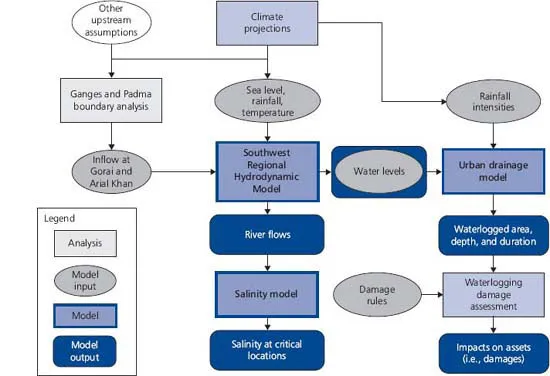
Source: Adapted from ADB.
Table 3 Features of the Three Mathematical Models
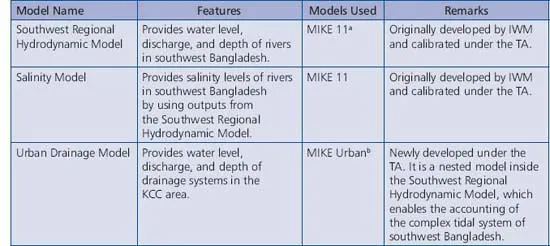
IWM = Institute of Water Modelling, KCC = Khulna City Corporation, TA = technical assistance.
a Mike 11 is a software program that could simulate flow and water level, water quality, and sediment transport in rivers. Mike 11 is a one-dimensional model.
b Mike Urban is a geographic information system-based urban water ...
Table of contents
- Front Cover
- Title Page
- Copyright Page
- Contents
- Tables and Figures
- Acknowledgmensts
- Abbreviations
- Weights and Measurements
- Introduction
- Study Approach and Methodology
- Estimating Impacts on the proposed Surface Water Supply Systems
- Estimating Impacts on the Current and Proposed Urban Draining System
- limitations and Conclutions
- Footnotes
- Back Cover
Frequently asked questions
Yes, you can cancel anytime from the Subscription tab in your account settings on the Perlego website. Your subscription will stay active until the end of your current billing period. Learn how to cancel your subscription
No, books cannot be downloaded as external files, such as PDFs, for use outside of Perlego. However, you can download books within the Perlego app for offline reading on mobile or tablet. Learn how to download books offline
Perlego offers two plans: Essential and Complete
- Essential is ideal for learners and professionals who enjoy exploring a wide range of subjects. Access the Essential Library with 800,000+ trusted titles and best-sellers across business, personal growth, and the humanities. Includes unlimited reading time and Standard Read Aloud voice.
- Complete: Perfect for advanced learners and researchers needing full, unrestricted access. Unlock 1.5M+ books across hundreds of subjects, including academic and specialized titles. The Complete Plan also includes advanced features like Premium Read Aloud and Research Assistant.
We are an online textbook subscription service, where you can get access to an entire online library for less than the price of a single book per month. With over 1.5 million books across 990+ topics, we’ve got you covered! Learn about our mission
Look out for the read-aloud symbol on your next book to see if you can listen to it. The read-aloud tool reads text aloud for you, highlighting the text as it is being read. You can pause it, speed it up and slow it down. Learn more about Read Aloud
Yes! You can use the Perlego app on both iOS and Android devices to read anytime, anywhere — even offline. Perfect for commutes or when you’re on the go.
Please note we cannot support devices running on iOS 13 and Android 7 or earlier. Learn more about using the app
Please note we cannot support devices running on iOS 13 and Android 7 or earlier. Learn more about using the app
Yes, you can access Adapting to Climate Change by in PDF and/or ePUB format, as well as other popular books in Biological Sciences & Global Warming & Climate Change. We have over 1.5 million books available in our catalogue for you to explore.