Sweet Chariot is a pathbreaking analysis of slave families and household composition in the nineteenth-century South. Ann Malone presents a carefully drawn picture of the ways in which slaves were constituted into families and households within a community and shows how and why that organization changed through the years. Her book, based on massive research, is both a statistical study over time of 155 slave communities in twenty-six Louisiana parishes and a descriptive study of three plantations: Oakland, Petite Anse, and Tiger Island.
Malone first provides a regional analysis of family, household, and community organization. Then, drawing on qualitative sources, she discusses patterns in slave family household organization, identifying the most significant ones as well as those that consistantly acted as indicators of change. Malone shows that slave community organization strongly reflected where each community was in its own developmental cycle, which in turn was influenced by myriad factors, ranging from impersonal economic conditions to the arbitrary decisions of individual owners. She also projects a statistical model that can be used for comparisons with other populations.
The two persistent themes that Malone uncovers are the mutability and yet the constancy of Louisiana slave household organization. She shows that the slave family and its extensions, the slave household and community, were far more diverse and adaptable than previously believed. The real strength of the slave comunity was its multiplicity of forms, its tolerance for a variety of domestic units and its adaptability. She finds, for example, that the preferred family form consisted of two parents and children but that all types of families and households were accepted as functioning and contributing members of the slave community.
“Louisiana slaves had a well-defined and collective vision of the structure that would serve them best and an iron determination to attain it, ” Malone observes. “But along with this constancy in vision and perseverance was flexibility. Slave domestic forms in Louisiana bent like willows in the wind to keep from shattering. The suppleness of their forms prevented domestic chaos and enabled most slave communities to recover from even serious crises.”
eBook - ePub
Sweet Chariot
Slave Family and Household Structure in Nineteenth-Century Louisiana
- 383 pages
- English
- ePUB (mobile friendly)
- Available on iOS & Android
eBook - ePub
About this book
Trusted by 375,005 students
Access to over 1.5 million titles for a fair monthly price.
Study more efficiently using our study tools.
Information
Part I
The Collective Experience and Louisiana Slave Household Organization
Chapter One
Family and Household Organization
Sweet Chariot focuses on a single aspect of the experience of slavery in rural Louisiana—the ways slaves were constituted into families and households within a community. Recent scholarship has contributed a rich storehouse of information, slave biographies and the oral histories of former slaves have provided a personal perspective, and collections of planters’ papers have proved invaluable. But even with all of these resources to draw upon, historians have found slave family, household, and community structure very difficult to describe with certitude. One is reminded of Peter Laslett’s now-famous question that in the late 1960s helped launch a new area of social history in Britain—did our ancestors have enough to eat?1 Just as bookshelves were filled with volumes detailing the lives and activities of kings and Parliament in seventeenth-century England, and yet very little was known about life among the common folk, so too we have little reliable information concerning one of the most basic elements of slave society: how slaves were organized into fundamental units of affection and support. To gain some insight into this problem, a basic framework of slave domestic organization was constructed through statistical analysis of slave communities in Louisiana. The major purpose of the statistical study was to arrive at a profile of slave household composition in rural Louisiana, 1810–64, the latter year being the last in which enough slave inventories were available to constitute a reliable set. The statistical profile that evolved is illustrated in table 1.1 and figure 1.1. One important clarification must be made before proceeding. Most historians of the family are primarily interested in the numbers and percentages of units belonging to each family household type in a sampled society because they are tracing the development of household forms. Although that information was generated, its analysis was not among the objectives of this study. I am more interested in the social reality—determining how many slaves were part of the various household types. I am only incidentally concerned with the evolution and variations of household types.
Explaining the meaning of the statistical model in terms of Louisiana slaves’ attempts to achieve stability and sustenance in their primary groups will engage the whole of this book, but the statistical findings can be quickly summarized. As can be seen in figure 1.1, nearly three-fourths of the sampled slaves were members of simple families, 6 percent lived in multiple family households, 2 percent were in extended family households, 1 percent formed non-nuclear households, and 18.3 percent were solitaires. For these broad categories, the data yielded few surprises or significant variations from conclusions arrived at by other historians. The most significant household types for Louisiana slaves were—in order—simple family, solitaire, and multiple family households; extended and non-nuclear forms had no numerical significance.
The simple family was the dominant household type among both slave and free populations of the nineteenth-century United States. Indeed, it has been called the prevailing household type for the whole of Western society for several centuries. It is not surprising, therefore, that nearly three-fourths of Louisiana slaves were organized into various classifications of the type (see figure 1.2). How slaves were grouped within this broad designation is of considerable significance. How many of the slaves formed part of families with both parents present? How many were part of households headed by only one parent, and how often was this single parent an unmarried mother? The debate around these questions will be discussed in the concluding chapter.
In the Louisiana sample, slightly fewer than one-half of the sampled slaves of all ages were members of standard nuclear family households, either as parents or as children, but this does not necessarily mean that slave families were hopelessly unstable. Residence in a standard nuclear family for 50 percent (or more) of the members in a slave community usually indicated that the community was relatively stable and mature. Signs of instability generally appeared in Louisiana communities only when the percentage of individuals in standard nuclear families dropped below about 40 percent.
TABLE 1.1. Household Composition among Rural Louisiana Slaves, 1810–1864 | |||||||
Household type | Total slaves | Number of units | Percent of total units in type | Mean n slaves | Mean size of unit | Percent of total slaves in type | |
| Solitaire | |||||||
| Females | 553.0 | 553.0 | 13.9 | 3.5 | 1 | 5.4 | |
| Males | 1,328.0 | 1,328.0 | 33.3 | 8.5 | 1 | 12.9 | |
| Non-nuclear | |||||||
| Co-resident siblings | 90.0 | 33.0 | 0.8 | 0.5 | 2.7 | 0.9 | |
| Co-resident relatives | – | – | – | – | – | – | |
| Unrelated co-residents | 33.0 | 9.0 | 0.2 | 0.2 | 3.6 | 0.3 | |
| Simple family | |||||||
| Married couple alone | 836.0 | 418.0 | 10.5 | 5.3 | 2.0 | 8.1 | |
| Married couple with children | 5,034.0 | 1,023.0 | 25.6 | 32.4 | 4.9 | 48.7 | |
| Single female with children | 1,493.0 | 439.0 | 11.0 | 9.6 | 3.4 | 14.5 | |
| Single male with children | 183.0 | 57.0 | 1.4 | 1.1 | 3.2 | 1.8 | |
| Extended family | |||||||
| Extended up | 28.0 | 5.0 | 0.1 | 0.1 | 5.6 | 0.3 | |
| Extended down | 55.0 | 14.0 | 0.4 | 0.3 | 3.9 | 0.5 | |
| Extended laterally | 113.0 | 23.0 | 0.6 | 0.7 | 4.9 | 1.0 | |
| Multiple family | |||||||
| Secondary unit up | 34.0 | 7.0 | 0.2 | 0.2 | 4.8 | 0.3 | |
| Secondary unit down | 510.0 | 72.0 | 1.8 | 3.2 | 7.0 | 4.9 | |
| Secondary unit lateral | 39.0 | 8.0 | 0.2 | 0.2 | 4.8 | 0.3 | |
| Total | 10,329.0 | 3,989.0 | 100.0 | 65.8 | 100.0 | ||
Source: Louisiana Slave Households Data Base.
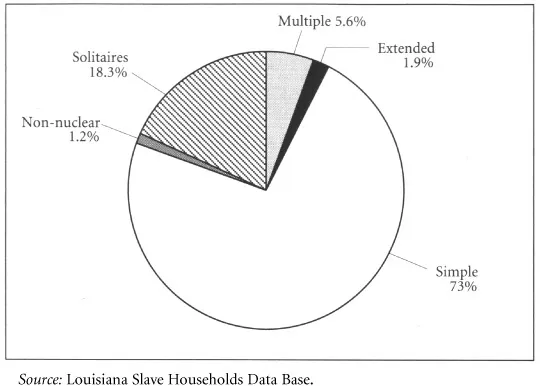
FIGURE 1.1.
Louisiana Slaves in Major Family Household Types, 1810–1864, by Percentage
Louisiana Slaves in Major Family Household Types, 1810–1864, by Percentage
Does the fact that about half of the slaves in the sample did not form households containing both parents and children mean that the traditionalists were right—that a large percentage of slaves resided in mother-headed households? The prevalence of families headed by single mothers was widely exaggerated in the old literature of slavery. In fact, it was the “myth of the matriarchy” that prompted many of the new studies of the slave family.2 This topic too will be extensively treated in the concluding chapter. As figure 1.2 shows, female-headed single-parent households did not predominate on most Louisiana holdings at any time, but the category encompassed 14.5 percent of the population. And in certain phases of slave community development, the numbers and percentages of slaves living in matrifocal households were much higher. Male-headed single parent households were extremely rare, almost never as much as 2 percent of the slave population. To complete the profile of the simple family categories, about 8 percent of the sampled slaves lived in households consisting of childless couples or couples whose children had departed the household.
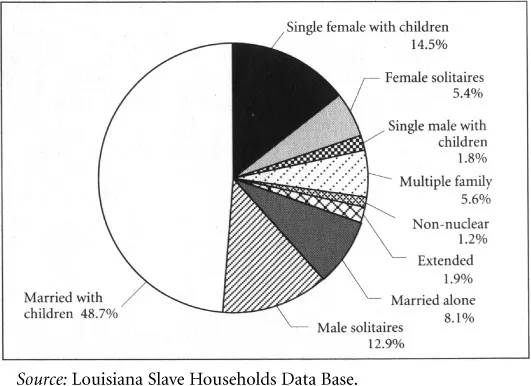
FIGURE 1.2.
Louisiana Slaves in Major Family Household Types, 1810–1864, with Simple Family Categories, by Percentage
Louisiana Slaves in Major Family Household Types, 1810–1864, with Simple Family Categories, by Percentage
Although the simple family household (and its subtypes) is perhaps the most informative category in the makeup of slave communities of Louisiana, the structure of slave society cannot be fully understood without taking all categories into account. The second largest number of slaves belonged to a household type that was not technically a family at all, the solitaires. Slaves were as likely to be part of this no-family group as they were to be a part of a single-parent household. The solitaires in Louisiana were always a force to be reckoned with, and, as in the case of the female-headed households, they often made up a much larger percentage than the 18 percent indicated in the overall sample. This was particularly true in the early, expansive, and unstable stages of community development. Solitaires also tended to be male rather than female, revealing a gender imbalance that is not reflected in the slave population as a whole.
Non-nuclear, extended, and multiple family households embraced smaller percentages of slaves than the simple family and solitaire household types. The non-nuclear category was by far the least significant household type, containing only about 1 percent of the slaves sampled. Most of the small number of non-nuclear family households were made up of co-resident siblings. Extended family households encompassed only 2 percent of the slaves, with small percentages in each of the forms of extension. Slaves in the multiple family classification totaled about 6 percent of the sample. The only form encountered frequently was that of downward disposition; it involved 5 percent of the sampled slaves and was quite common in the later stages of community development because it involved three generations. Most commonly, it consisted of a nuclear family unit plus an unmarried daughter and grandchild, the latter two forming the second “family” or conjugal unit.
What does this composite profile mean for the experience of an “average” slave? First, it suggests that in nineteenth-century rural Louisiana a slave had less than a fifty-fifty chance of being part of a family consisting of children and both parents. This grim reality reflects the vulnerability of slave families to forced separations, but it also reflects a greater openness among slave families to alternative forms, a flexibility that slowly evolved from necessity. The odds are also influenced by a variable that has nothing to do with slavery—the high mortality rates in Louisiana that frequently separated mates and robbed children of at least one parent.
A second and more positive conclusion that can be drawn from the profile is that nearly three-quarters of the sampled slaves lived in households of blood relatives, in families that might consist of both parents and their children, or childless married couples, or single parents and their children, or some extended or multiple family unit, or even a household consisting of cousins or siblings. In some form, a family made up of very close kin residing together and identifying with each other met the psychological needs of a majority of Louisiana slaves and afforded as much protection as the system of slavery would allow.
It is true that roughly one-fifth of the sampled slaves had no discernible close relations, but solitaires were in no way excluded from a general sense of community. The multifaceted slave community indeed functioned as an extension of the conjugal family, as suggested by Blassingame, Genovese, Gutman, and others. United by shared circumstances, intimate working and living conditions, and a common set of cultural values, a slave residential and working unit generally developed into a supportive community within a few years, especially if even remote kinship was initially present. Though families predominated in the slave communities studied, no evidence was found to suggest that solitary members were shunned or stigmatized.
My statistical study supplemented by traditional research suggests that in their domestic organizations, as well as their cultural forms, Louisiana slaves found ways to take care of their own and to mitigate some of the harshness of life in slavery’s shadow. Because slaves lacked the autonomy to form separate formalized institutions, informal education, socialization, religious activity, occupational training, courtship, and even internal governance often took place within the framework of their domestic organizations—the family, household, kinship group, and community. Domestic organizations provided slaves with a safe house where masks could be dropped. Perhaps the aspect of slaves’ existence least recognized by their owners was the well-guarded richness and surprising strength of their family life and community structure.
The construction or model described in the foregoing pages was the composite household organization found among 10,329 slaves who lived in Louisiana from 1810 to 1864. It provides a profile, a useful “norm.” But it represents a large and static time span and does not take into consideration variations in slave household structure within segments of that time span. Therefore, statistics were generated concerning household organization by decennial intervals, as well as by the size of the slaveholding and the geographic area and type of agriculture associated with the community. The first of these factors turned out to be of signal importance. The patterns that emerged when household development was related to decades contributed greatly to the development of a second model, which takes into account cyclical variations in slave household composition.
Chapter Two
The Effects of Periodization
The statistical model explained in Chapter 1 provides a profile of domestic organization found among more than ten thousand slaves who lived in Louisiana during the course of half a century. But much might depend upon when the slave lived during that broad time span. To gauge whether slave household composition varied significantly by time period, the sampled communities were analyzed by decades.
LOUISIANA SLAVE HOUSEHOLD COMPOSITION, 1810–1819
Among the broad exter...
Table of contents
- Cover Page
- Sweet Chariot
- Copyright Page
- Dedication
- Contents
- Tables, Figures and Maps
- Acknowledgments
- Introduction
- Part I The Collective Experience and Louisiana Slave Household Organization
- Part II The Developmental Cycle of Three Louisiana Slave Communities
- Part III Patterns
- Appendix A: Developmental Patterns in Louisiana Slave Communities
- Appendix B: Households and Housefuls in Oakland’s Slave Quarter
- Notes
- Bibliography
- Index
Frequently asked questions
Yes, you can cancel anytime from the Subscription tab in your account settings on the Perlego website. Your subscription will stay active until the end of your current billing period. Learn how to cancel your subscription
No, books cannot be downloaded as external files, such as PDFs, for use outside of Perlego. However, you can download books within the Perlego app for offline reading on mobile or tablet. Learn how to download books offline
We are an online textbook subscription service, where you can get access to an entire online library for less than the price of a single book per month. With over 1.5 million books across 990+ topics, we’ve got you covered! Learn about our mission
Look out for the read-aloud symbol on your next book to see if you can listen to it. The read-aloud tool reads text aloud for you, highlighting the text as it is being read. You can pause it, speed it up and slow it down. Learn more about Read Aloud
Yes! You can use the Perlego app on both iOS and Android devices to read anytime, anywhere — even offline. Perfect for commutes or when you’re on the go.
Please note we cannot support devices running on iOS 13 and Android 7 or earlier. Learn more about using the app
Please note we cannot support devices running on iOS 13 and Android 7 or earlier. Learn more about using the app
Yes, you can access Sweet Chariot by Ann Patton Malone in PDF and/or ePUB format, as well as other popular books in Social Sciences & North American History. We have over 1.5 million books available in our catalogue for you to explore.