In this book, advanced methods and techniques of monitoring, fault diagnostics, and predictive maintenance for cryogenics are illustrated. In Part I on Background, mainstreams in the related research are reviewed. In Part II of Methods, for monitoring helium distribution and consumption in cryogenic systems for particle accelerators, a virtual flowmeter is presented. Then, for fault diagnostics, two methods, for fault detection on a compressor, and for distributed diagnostics based on a micro-genetic algorithm, are described. Finally, for predictive maintenance, a metaheuristic optimization scheduling algorithm is illustrated. In Part III of Application examples, several practical case studies are described for highlighting the application of the previous methods to cryogenics of particle accelerators at CERN.
- 154 pages
- English
- ePUB (mobile friendly)
- Available on iOS & Android
eBook - ePub
Cryogenic Systems
About this book
Trusted by 375,005 students
Access to over 1.5 million titles for a fair monthly price.
Study more efficiently using our study tools.
Information
PART I
BACKGROUND
CHAPTER 1
ADVANCED MONITORING SYSTEMS
Man is the measure of all things.
—Protagoras
1.1 OVERVIEW
In this chapter, a background on developments of monitoring, fault diagnostics, and predictive maintenance systems for cryogenic processes is presented. The main aim is making the reader familiar with concepts useful for a better comprehension of the book core in the following parts. In particular, main concepts of advanced monitoring, data acquisition, automatic fault detection, automatic fault diagnostics, and advanced maintenance are illustrated.
1.2 ADVANCED MONITORING
In the strictest meaning of the term, monitoring a system (e.g., a process, a plant, or a service) means the regular observation and recording of activity, components, and processes in the system [69]. This monitoring activity is to be carried out usually automatically, by continuously acquiring data from a set of transducers disseminated over the monitored system, in order to display updated “pictures” of the system status. The resulting information is used to analyze and evaluate the all of the components of the system in order to measure its effectiveness and quality, as well as adjust where necessary. With respect to supervisory control and data acquisition (SCADA), in this book, the focus will be placed mainly on measurements, high-level process supervisory management, and anomaly handling and recovery. In SCADA, main emphasis is given to control: a control system uses computers, networked data communications, and graphical user interfaces other peripheral devices such as programmable logic controllers and discrete proportional-integral-derivative (PID) controllers to interface to the process plant or machinery.
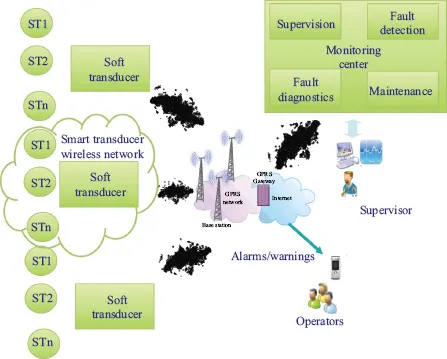
Figure 1.1. Architecture of a monitoring system (ST: Smart Transducer).
In the more comprehensive meaning used in this book, apart from the above-mentioned features for recording and displaying, Advanced monitoring also includes several additional functions, illustrated in the architecture of Figure 1.1.
• Data acquisition by Soft Transducers, a subclass of virtual instruments, that is, software programs used in measurement automation for interfacing actual instrumentation [17], [70]. In a Soft Transducer, the user interface is minimal or not existing at all. Furthermore, differently from physical sensors, a non-easily measurable quantity is assessed indirectly by combining data sensed by a group of heterogeneous Smart Transducers (ST in Figure 1.2).
• Fault Detection, for revealing the presence of an anomaly in the system working, and issuing the suitable alarms and management actions. About that, the concept of fault is remarkable: an anomaly capable of deviating significantly the system working quality from its nominal conditions. This concept is to be distinguished from the failure, where the deviation arrives to compromise definitively the operation of the system up to a stop.
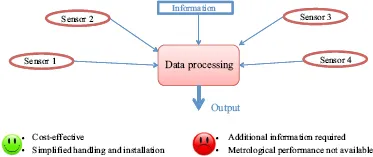
Figure 1.2. Architecture of a Smart Transducer.
• Fault Diagnostics, for providing information like size, time, location, and effects of faults, as well as a decision support system for maintenance and repair, and definitively, a sound basis for the development of fault-tolerant systems.
• Fault Maintenance, for “actions necessary for retaining or restoring a piece of equipment, machine, or system to the specified operable condition to achieve its maximum useful life” (Business Dictionary). About this, remarkable is the concept of scheduling, an optimization process aimed at defining the best activity sequence to minimize the expected cost over a time horizon.
In the following sections, these functions will be detailed.
1.3 DATA ACQUISITION
Monitoring underlies the concept of a data acquisition, that is, the process of sampling signals that measure actual physical conditions and converting the resulting samples into digital numeric values to be deployed by a computer.
1.3.1 PERSPECTIVES
The monitored systems have been until last year’s complex systems, like transportation systems, urban and sub-urban infrastructure systems, military and defense systems, commercial systems, power and energy generation and distribution systems, or large experimental systems, like accelerators, particle detectors, fusion reactors, telescopes, or a factory for processing products, like a refinery, or even a large container ship.
But, recently, the advent of Internet of Things has made monitoring systems more pervasive in our everyday life [71]. Internet of Things (IoT) implies an Internet working of simpler physical devices (also referred to as “connected devices” and “smart devices”), for example, vehicles, buildings, apartments, and other everyday items. These are embedded with electronics, software, sensors, actuators, and network connectivity, for allowing these objects to collect and exchange data. The IoT allows objects to be monitored and/or controlled remotely through existing network infrastructure, integrating directly the physical into the digital world. The aim is to augment efficiency, accuracy, and economic benefit. The resulting directly implied market is estimated to reach almost 50 billion objects by 2020.
When reality is augmented with sensors and actuators [72], monitoring concerns with the wider category of cyber-physical systems, where each physical object interacts with the human and automaton perception through its embedded computing system, but above all, inter-operates within the existing Internet infrastructure. In this way, monitoring becomes also an important dowel of the operating framework of the Augmented Reality (AR): the physical elements of a live direct monitored display of real-world environment are augmented (i.e., supplemented) by computer-generated sensory input such as sound, video, graphics, or other data. In other terms, a picture of the physical world is integrated into the digital information world by a computer. Consequently, monitoring allows our current perception of reality to be enhanced, enriched, and enforced by a further dimension.
Augmentation is implemented usually in real time, by integrating advanced monitoring and AR technology (e.g., data acquisition, computer vision, and object recognition). In other terms, useful information about the environment and its main components is overlaid on the physical world. This information is a mix of virtual and real data, for example, seeing other real-sensed or measured information such as the roof and the upper missing parts of columns in an ancient Greek temple overlaid in accurate position where they actually were in space. This information integration makes the physical world surrounding the user not only interactive and digitally manipulable, but also subject of an enhanced perception. In this way, real-time monitoring is going to open new and exciting scenarios to our world of perception.
1.3.2 ARCHITECTURE
Data acquisition systems, usually shortened by the acronyms DAS or DAQ, typically include the following basic constituents (Figure 1.3).
• Transducers, to convert physical parameters to electrical signals more easily measurable;
• Conditioners, to adapt transducers output to the input of digital values converters;
• Hardware (HW), mainly based on analog-to-digital converters, to convert conditioned sensor signals to digital values;
• Software (SW) programs for managing data acquisition and for further analysis;
• Data transmission to Cloud or Internet.
1.3.3 CLASSIFICATION
A classification of data acquisition architectures based on their physical dimensions is reported in Figure 1.4. At the bottom of the dimension scale (order of few mm), there are on-chip programmable DAQ devices, mainly based on microcontrollers, having embedded nonvolatile memory (ROM, EPROM, FLASH), where the program resides, volatile memory (RAM) for the registers and the data, decoding network for I/O, several peripherals (DAC, ADC, comparators, serial interfaces, etc.), a timer, and last but not least, with a reduced instruction set. By exploiting such capabilities, a smart transducer can be realized: signals arising from several sensors of different quantities can be acquired and the related data can be pre-processed, by implementing even complex measurement algorithms, and finally sending results via the communication interface. In this way, high-level functionality for applications requiring additionally more complex features (e.g., fault-tolerance or distributed computing) can be achieved to cope with complexity at a fair price.
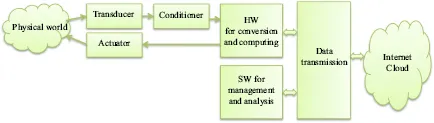
Figure 1.3. Architecture of a data acquisition system.
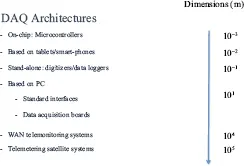
Figure 1.4. Classification of monitoring systems.
By rising the dimension (order of few cm), there are DAQ based on tablets or smart -phones. In fact, modern smart-phones embed several sensor technologies, thus they can be exploited as stand-alone measurement instruments on a wide range of application domains [73]. Furthermore, the smartphone can exchange data with other devices (e.g., wireless sensor nodes, data acquisition boards, etc.) through wireless or wired interfaces. In this way, a new generation of smart-phone applications, considering the smart-phone as a hand-held measurement device, arises. The sensors, usually embedded on a smart phone, communicate to the a...
Table of contents
- Cover
- Half-title Page
- Title Page
- Copyright
- Dedication
- Contents
- List of Figures
- List of Tables
- Acknowledgments
- Introduction
- Part I: Background
- Part II: Methodology
- Part III: Application Examples
- Conclusions
- About the Authors
- References
- Index
- Backcover
Frequently asked questions
Yes, you can cancel anytime from the Subscription tab in your account settings on the Perlego website. Your subscription will stay active until the end of your current billing period. Learn how to cancel your subscription
No, books cannot be downloaded as external files, such as PDFs, for use outside of Perlego. However, you can download books within the Perlego app for offline reading on mobile or tablet. Learn how to download books offline
Perlego offers two plans: Essential and Complete
- Essential is ideal for learners and professionals who enjoy exploring a wide range of subjects. Access the Essential Library with 800,000+ trusted titles and best-sellers across business, personal growth, and the humanities. Includes unlimited reading time and Standard Read Aloud voice.
- Complete: Perfect for advanced learners and researchers needing full, unrestricted access. Unlock 1.5M+ books across hundreds of subjects, including academic and specialized titles. The Complete Plan also includes advanced features like Premium Read Aloud and Research Assistant.
We are an online textbook subscription service, where you can get access to an entire online library for less than the price of a single book per month. With over 1.5 million books across 990+ topics, we’ve got you covered! Learn about our mission
Look out for the read-aloud symbol on your next book to see if you can listen to it. The read-aloud tool reads text aloud for you, highlighting the text as it is being read. You can pause it, speed it up and slow it down. Learn more about Read Aloud
Yes! You can use the Perlego app on both iOS and Android devices to read anytime, anywhere — even offline. Perfect for commutes or when you’re on the go.
Please note we cannot support devices running on iOS 13 and Android 7 or earlier. Learn more about using the app
Please note we cannot support devices running on iOS 13 and Android 7 or earlier. Learn more about using the app
Yes, you can access Cryogenic Systems by Pasquale Arpaia, Mario Girone, Vitaliano Inglese, Marco Pezzetti in PDF and/or ePUB format, as well as other popular books in Technology & Engineering & Electrical Engineering & Telecommunications. We have over 1.5 million books available in our catalogue for you to explore.