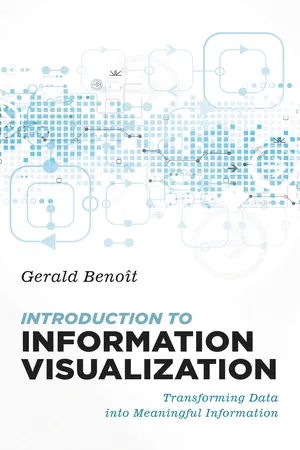
Introduction to Information Visualization: Transforming Data into Meaningful Information is for anyone interested in the art and science of communicating data to others. It shows readers how to transform data into something meaningful - information.
Applying information visualization in research, service, teaching, and professional life requires a solid understanding of graphic design and the aesthetic along with hands-on skills and knowledge of data principles and software. This book is applicable to students in all domains, to researchers who need to understand how to create graphics that explain their data, and to professionals and administrators for professional development training. Website Designers and Human-Computer Interaction researchers will appreciate the backstory of designing interactive visualizations for the web.
Drawing on the author's years of practice and teaching, it bridges the two worlds in ways everyone can participate in the future of information and to appreciate the beautiful in information:
Step-by-step directions in the fundamentals of HTML5, CSS, and d3.jsDesign challenges with fully explained answersWeb-site support for code samples (JavaScript, d3.js, python), live examples, and a place to build a community of other IV prosUseful for teaching design to scientists; data to the humanitiesGuidance for using the text depending on the class makeupReview of third-party visualization software, big data trends, and script librariesGuidance on how to continue in the IV world after graduation
This full-color book features graphics and a companion Web site.
The online companion site hosts living examples, updates, and errata. You're invited to participate on the site, too, sharing your questions, solutions, and ideas. For most readings, there is a partner design lab. At the conclusion of the course, there is a complete interactive information visualization service documentation for libraries.
eBook - PDF
Introduction to Information Visualization
Transforming Data into Meaningful Information
- 225 pages
- English
- PDF
- Available on iOS & Android
eBook - PDF
Introduction to Information Visualization
Transforming Data into Meaningful Information
About this book
Information
Table of contents
- Contents
- Preface
- Acknowledgments
- Chapter 1 Introduction
- Chapter 2 The Ethics/Aesthetics of Information
- Chapter 3 The Art of Information Visualization
- Chapter 4 The Technology of Information Visualization
- Chapter 5 The Thought behind Creating a Visualization
- Chapter 6 The Data of Visualization
- Chapter 7 Real-World Visualizations and Text Visualizations
- Appendix A Data and Information Ecosystems
- Appendix B More about Data, Learning, and Visualization
- Index
- About the Author
Trusted by 375,005 students
Access to over 1.5 million titles for a fair monthly price.
Study more efficiently using our study tools.
Frequently asked questions
Yes, you can cancel anytime from the Subscription tab in your account settings on the Perlego website. Your subscription will stay active until the end of your current billing period. Learn how to cancel your subscription
No, books cannot be downloaded as external files, such as PDFs, for use outside of Perlego. However, you can download books within the Perlego app for offline reading on mobile or tablet. Learn how to download books offline
Perlego offers two plans: Essential and Complete
- Essential is ideal for learners and professionals who enjoy exploring a wide range of subjects. Access the Essential Library with 800,000+ trusted titles and best-sellers across business, personal growth, and the humanities. Includes unlimited reading time and Standard Read Aloud voice.
- Complete: Perfect for advanced learners and researchers needing full, unrestricted access. Unlock 1.5M+ books across hundreds of subjects, including academic and specialized titles. The Complete Plan also includes advanced features like Premium Read Aloud and Research Assistant.
We are an online textbook subscription service, where you can get access to an entire online library for less than the price of a single book per month. With over 1.5 million books across 990+ topics, we’ve got you covered! Learn about our mission
Look out for the read-aloud symbol on your next book to see if you can listen to it. The read-aloud tool reads text aloud for you, highlighting the text as it is being read. You can pause it, speed it up and slow it down. Learn more about Read Aloud
Yes! You can use the Perlego app on both iOS and Android devices to read anytime, anywhere — even offline. Perfect for commutes or when you’re on the go.
Please note we cannot support devices running on iOS 13 and Android 7 or earlier. Learn more about using the app
Please note we cannot support devices running on iOS 13 and Android 7 or earlier. Learn more about using the app
Yes, you can access Introduction to Information Visualization by Gerald Benoit in PDF and/or ePUB format, as well as other popular books in Languages & Linguistics & Data Visualisation. We have over 1.5 million books available in our catalogue for you to explore.