"A thorough and enlightening survey of the impact and legacy of the Great Recession on low-income Americans . . . accessible and readable." —
Journal of American Studies
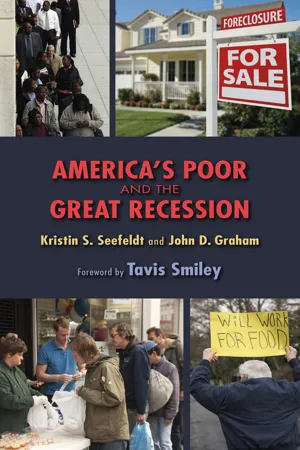
Millions entered poverty as a result of the Great Recession's terrible toll of long-term unemployment. In this book, Kristin S. Seefeldt and John D. Graham examine recent trends in poverty and assess the performance of America's safety-net programs.
They consider likely scenarios for future developments and conclude that the well-being of low-income Americans, particularly the working poor, the near poor, and the new poor, is at substantial risk despite economic recovery.
"[This] primer on the state of America's poor in the wake of the Great Recession of 2007 to 2009 cuts through Beltway theater and provides a clear picture of the magnitude of poverty of the United States as well as the patchwork nature of social services targeting the poor." —
Journal of Policy Analysis and Management
- 178 pages
- English
- ePUB (mobile friendly)
- Available on iOS & Android
eBook - ePub
America's Poor and the Great Recession
About this book
Information
1
The Great Recession
Definition, Duration, and Impact
A recession is an overall slowdown in economic activity in a geographic region, as opposed to a slowdown in sales by a particular company or in a specific industry sector. The key measures of economic activity are Gross Domestic Product (GDP), income, employment, industrial production, and sales of goods at the wholesale and retail levels. The GDP is a measure of the overall value of goods and services produced by the economy. It is widely watched by market actors to determine whether the economy is expanding or shrinking.
Countries around the world vary in how a recession is defined and who is empowered to make the determination. In the United Kingdom, for example, recessions are generally defined by the government with a strict numeric definition: two consecutive quarters—or a total of six months—of negative growth in GDP constitutes a recession. The term “negative growth” means that the overall size of the economy is actually declining rather than increasing, as is typical of a healthy economy.
In the United States, the definition of recession has some degree of subjectivity because a committee of economists is tasked with determining whether there has been “a significant decline in economic activity spread across the economy, lasting more than a few months.”1 Since 1920, this determination has been made by the National Bureau of Economic Research (NBER), a private nonprofit research organization based in Cambridge, Massachusetts. The NBER “Business Cycle Dating Committee” looks at a variety of economic indicators (not GDP alone) and determines when a decline in economic activity occurred, whether it was “significant” (in severity), and—if a recession has occurred—when a recession ended. The number of months from when the economy began to decline (starting from its peak) to when the economy started to recover (the trough- its lowest point) is the duration of the recession.
According to the determinations of NBER, 17 recessions in the United States have occurred since World War I (see Table 1). They range in duration from six months (January to July 1980) to 43 months in the case of the Great Depression (August 1929 to March 1933).2 When a recessionary economy reaches its trough and the next expansion begins, the economy usually expands for at least several years. There is only one case in modern U.S. history of a double-dip recession, meaning that the economy began to expand and then slipped back into recession (January 1980 to July 1980; July 1981 to November 1982). Some analysts refer to this period loosely as the recession of 1980–1982.
Changes in the unemployment rate, though watched closely by politicians as well as economists, are not used in defining when a recession begins and ends. When an economy is growing and is nearing its peak, the rate of decline in the unemployment rate actually tends to slow and the rate may even rise a bit, before the economy reaches its peak size (measured by GDP). At this stage of the business cycle, the unemployment rate is a “leading” indicator of where the economy is headed. On the other hand, the unemployment rate also acts as a “lagging” indicator when a recession ends because unemployment continues to rise after the official recovery has begun. Thus, the hardships induced by a recession, often measured by the amount and duration of unemployment, occur in the aftermath of the recession as well as during the official recessionary period.
In general terms, contractions in the modern U.S. economy appear to be related to one or more of six types of “shocks”: oil prices, monetary policy, productivity, uncertainty, liquidity-financial risk, and fiscal policy. Recessions tend to be more severe when the economy is subjected to multiple shocks rather than only one.
Market analysts sometimes talk about “shocks” and the “business cycle,” including peaks and troughs, as if it can be predicted when recessions will begin and end. If anyone had such knowledge (and others did not), the informed individual could make a fortune in the stock market, since the average values of stocks are influenced by business cycles. Despite the many boastful claims that are made about economic forecasting, validated models that predict whether a recession will occur, and when it will begin and end, have remained elusive.3
Table 1. U.S. Business Cycle Expansions and Contractions, 1920-2007. Contractions (recessions) start at the peak of a business cycle and end at the trough.


Periods of contraction and recovery do not affect everyone equally. The pattern during the last three decades in the United States has been one of disproportionate hardships for men, blacks, Hispanics, younger workers, and less educated workers. Those recession-induced hardships are measured by changes in employment, hours of work, earnings, and income.4
Men, in particular, are more likely to be affected by changes in the labor market than are women. This is attributable largely to the fact that men are more likely than women to be employed in industries such as construction and manufacturing that typically slow down during a recession. Economists say that these industries are “cyclical” in nature. Women are more likely to be employed in less cyclical industries such as services and the public sector.
The Great Recession of 2007–2009
The United States recession that occurred from December 2007 through July 2009 was triggered by an initial spike in oil prices and a correction in housing prices, followed by a financial crisis, financial market disruptions, and prolonged uncertainty, in part due to policy uncertainty.5 This period is called the “Great Recession” because it is the longest recession (18 months) since the Great Depression (43 months), much longer than the duration of the average recession (11 months) in the post–World War II period. As we shall see, the Great Recession is also unusual because of the extent of hardship that it caused in the United States, much more than in any downturn since the 1930s.
During the Great Depression, the unemployment rate in the United States surpassed 25 percent. By way of comparison, the unemployment rate more than doubled due to the Great Recession, from 4.5 percent in November 2007 to a peak of 10.6 percent in January 2010, though it had declined to 8.2 percent by June 2012 and 7.8 percent in September 2012. Thus, the Great Recession—as harmful as it was—is not on par with the Great Depression in the scale of hardship that was inflicted. The recession of 1980–82 also saw unemployment exceed 10 percent, but the pace of recovery in job growth has been much slower in the aftermath of the Great Recession than it was after the 1980–82 recession. No other post–World War II recession comes close to matching the adverse job impacts of the Great Recession.6
A sluggish recovery of the U.S. economy, measured by GDP growth, has been underway since July 2009. The upturn seemed to accelerate somewhat in late 2011, but slowed down a bit in 2012 after a holiday burst. Although fears of a possible double dip recession rose and diminished several times during the post-2009 recovery, the overall pace of GDP growth has remained positive but below 3 percent per year, much too slow to generate a rapid fall in the unemployment rate.
Underemployment
A good overall indicator of the health of a country’s labor market is the rate of underemployment, which is defined as the sum of the unemployment rate and the part-time employment rate (counting part-time workers who would like more hours of work). As an alternative to the official unemployment rate reported by U.S. federal government, since January 2010, Gallup has been publishing an underemployment measure based on daily national telephone surveys, including cell phones as well as landlines.7 Gallup surveys a total of 30,000 Americans each month to track their employment situation.
The bad news is that the underemployment rate is much higher than the unemployment rate, estimated by Gallup at 17.5 percent in June 2012. This figure translates into about 20 million underemployed Americans. The June 2012 underemployment count was comprised of an 8.0 percent unemployment rate and a 9.5 percent rate of part-time work by employees seeking more hours of work.8
The good news is that the underemployment rate began trending downward in 2010 at a slightly stronger pace than the official unemployment rate. The underemployment rate was 19.5 percent in January 2010, rose briefly to 20.0 percent in April 2010 and then declined slowly to 19.0 percent in January 2011. Steady progress pushed the rate down to 17.8 percent in October 2011, but the rate rose again for four consecutive months to 19.1 percent in February 2012, before beginning to gradually decline again.
Long-Term Unemployment
The U.S. Bureau of Labor Statistics defines long-term unemployment as being unemployed for 27 weeks or longer, yet still looking for work. In some reports, 27 weeks is referred to as six months. When economic downturns occur, the absolute number of the long-term unemployed rises, as does the percentage of the unemployed who have been out of work for 27 weeks or more. High rates of long-term unemployment are a distinctive feature of the Great Recession.
Prior to the Great Recession, the number of long-term unemployed in the United States was fluctuating between 1.1 million and 1.3 million during 2006 and 2007. The count remained stable for the first five months of the Great Recession (December 2007 to April 2008), but then rose sharply to 1.6 million in June 2008, 2.6 million in December 2008, and 4.4 million in June 2009. Although the Great Recession ended in June 2009, the count of the long-term unemployed continued to rise to 6.1 million in December 2009 and to a peak of 6.7 million in June 2010.
The ensuing fall was due to a combination of improving economic conditions and a departure from the labor force of many discouraged job searchers. In any event, the count of long-term unemployed diminished rapidly for three months (to 6.1 million in September 2010). Yet it proceeded to rise again for three consecutive months (to 6.4 million in December 2010). There was no progress for the first eight months of 2011 but then, as if to bring some holiday cheer, the count dropped from 6.2 million in September 2011 to 5.6 million in December 2011. The first three months of 2012 showed a continued decline, but the trend reversed itself and rose to 5.4 million by June 2012.9 Thus, according to the 27+ week definition, the count of long-term unemployed Americans increased by a factor of 5.6 from 2006 to mid-2010, with only a 20 percent decline in the count over the next two years.
Using a somewhat different measure (unemployment for a year or more), a study by Pew Charitable Trusts finds a similar pattern: The proportion of unemployed people who have been without a job for more than a year tripled from 9.5 percent in the first quarter of 2008 to 29.5 percent in the first quarter of 2012. In other words, in early 2012—almost 2.5 years after the official end of the Great Recession—nearly 13.3 million adults were jobless and looking for work, and 3.9 million of them had been looking for a year or longer.10
Bouts of unemployment became so long in the period after the Great Recession that the U.S. Department of Labor decided that they needed to change a key question on their major employment survey. Prior to January 2011, the “Current Population Survey” (CPS) did not allow respondents to indicate that they had been unemployed for longer than two years. If a respondent answered more than two years, the CPS coders put down two years in the official federal data file. Starting with January 2011, respondents were allowed to report unemployment durations up to five years. In future economic downturns, it will be feasible to track the frequency of very long bouts of unemployment and compare them to the very long bouts experienced after the Great Recession.11 As we argue in the next chapter, longterm bouts of unemployment are ti...
Table of contents
- Cover
- Half title
- Title
- Copyright
- Contents
- Foreword
- Preface
- Introduction
- 1 The Great Recession: Definition, Duration, and Impact
- 2 The Impact of the Great Recession on Poverty in the U.S.
- 3 Philanthropy and America’s Poor
- 4 America’s Partial Safety Net
- 5 Risks to the Safety Net in the Aftermath of the Great Recession
- 6 Policy Options for Strengthening the Safety Net
- Notes
- Index
Trusted by 375,005 students
Access to over 1.5 million titles for a fair monthly price.
Study more efficiently using our study tools.
Frequently asked questions
Yes, you can cancel anytime from the Subscription tab in your account settings on the Perlego website. Your subscription will stay active until the end of your current billing period. Learn how to cancel your subscription
No, books cannot be downloaded as external files, such as PDFs, for use outside of Perlego. However, you can download books within the Perlego app for offline reading on mobile or tablet. Learn how to download books offline
Perlego offers two plans: Essential and Complete
- Essential is ideal for learners and professionals who enjoy exploring a wide range of subjects. Access the Essential Library with 800,000+ trusted titles and best-sellers across business, personal growth, and the humanities. Includes unlimited reading time and Standard Read Aloud voice.
- Complete: Perfect for advanced learners and researchers needing full, unrestricted access. Unlock 1.5M+ books across hundreds of subjects, including academic and specialized titles. The Complete Plan also includes advanced features like Premium Read Aloud and Research Assistant.
We are an online textbook subscription service, where you can get access to an entire online library for less than the price of a single book per month. With over 1.5 million books across 990+ topics, we’ve got you covered! Learn about our mission
Look out for the read-aloud symbol on your next book to see if you can listen to it. The read-aloud tool reads text aloud for you, highlighting the text as it is being read. You can pause it, speed it up and slow it down. Learn more about Read Aloud
Yes! You can use the Perlego app on both iOS and Android devices to read anytime, anywhere — even offline. Perfect for commutes or when you’re on the go.
Please note we cannot support devices running on iOS 13 and Android 7 or earlier. Learn more about using the app
Please note we cannot support devices running on iOS 13 and Android 7 or earlier. Learn more about using the app
Yes, you can access America's Poor and the Great Recession by Kristin S. Seefeldt,John D. Graham in PDF and/or ePUB format, as well as other popular books in Social Sciences & North American History. We have over 1.5 million books available in our catalogue for you to explore.