Forty years after the declaration of the "war on drugs" by President Nixon, the debate on the effectiveness and costs of the ban is red-hot. Several former Latin American presidents and leading intellectuals from around the world have drawn attention to the ineffectiveness and adverse consequences of prohibitionism. This book thoroughly analyzes the drug policies of one of the main protagonists in this war.The book covers many topics: the economics of drug production, the policies to reduce consumption and decrease supply during the Plan Colombia, the effects of the drug problem on Colombia's international relations, the prevention of money laundering, the connection between drug trafficking and paramilitary politics, and strategies against organized crime. Beyond the diversity in topics, there is a common thread running through all the chapters: the need to analyze objectively what works and what does not, based on empirical evidence. Presented here for the first time to an English-speaking audience, this book is a contribution to a debate that urgently needs to transcend ideology and preconceived opinions.
eBook - ePub
Anti-Drug Policies in Colombia
Successes, Failures, and Wrong Turns
- English
- ePUB (mobile friendly)
- Available on iOS & Android
eBook - ePub
Anti-Drug Policies in Colombia
Successes, Failures, and Wrong Turns
About this book
Trusted by 375,005 students
Access to over 1.5 million titles for a fair monthly price.
Study more efficiently using our study tools.
Information
Topic
DirittoSubtopic
Diritto internazionalePART I: DIMENSION OF THE DRUG PROBLEM IN COLOMBIA
Production, Trafficking, and Consumption
1
The Microeconomics of Cocaine Production and Trafficking in Colombia
Estimates Updated through 2012
Daniel Mejía and Daniel M. Rico
This chapter presents a detailed X-ray of the microeconomics of cocaine production and trafficking in Colombia and presents the estimates updated through 2012. The chapter first presents a brief description of the evolution over time of the aggregate figures on cocaine production and then focuses on a detailed description of each link in the cocaine production and trafficking chain. In particular, it describes the main costs and revenues in each link of the production chain and, on the basis of the available information, provides an estimate of the flows through the Colombian economy of the money that results from these illegal activities. The phases of the production of cocaine chlorhydrate include transformations of the raw material (coca leaf), undertaken in the peasant-farmer (campesino) economy and aimed at the small- and medium-scale production of coca base; the involvement of illegal armed groups in the links that produce the greatest aggregate value; and complex networks for the distribution of chemical precursors and the control of the routes for narcotics trafficking.
Our estimates indicate that, on the basis of data for 2012, the size of the illegal drug business in Colombia is between $4.5 and $5.5 billion per year, which corresponds to about 1.2 percent of Colombian GDP. While a small part of this aggregate figure is produced in the initial stages of production (coca cultivation and coca paste and base production), the bulk of it (approximately 70 percent) is produced in the trafficking stage (e.g., when cocaine is transported from the processing labs in remote areas of the country to the Pacific coast or the border with Venezuela to be shipped to the main consumer markets in North America and Europe).
INTRODUCTION
As cocaine is an illegal substance, one should be cautious when analyzing the figures on its production and trafficking. The existing academic literature on this subject has focused on describing the evolution over time of aggregate (“macro”) figures for the production of coca leaves and cocaine, and the prices at the intermediate and final stages of the production chain (Mejía and Posada 2010). The two main sources for these aggregate indicators are the United Nations Office on Drugs and Crime (UNODC) and the US Office of National Drug Control Policy (ONDCP). Given the large amount of information and analysis available on the aggregate indicators of the cocaine market in Colombia (Mejía and Posada 2010; US Government Accountability Office [GAO] 2008; and several annual reports of the UNODC), this chapter presents a brief description of them only to give the reader a perspective on the evolution over time of the size of this illegal business in Colombia. Next, the chapter concentrates on making as detailed an X-ray as possible of the microeconomics of cocaine production and trafficking in Colombia, which had not been sufficiently done so far by academic studies on this subject. In particular, this chapter gives a detailed description of each step in the cocaine production chain, the agents involved in it, the inputs and production costs in each of the stages, the types of contracts that the different agents enter into, and the value of the production at each stage.
Behind the nearly 48,000 hectares where coca is grown and the 410 metric tons of cocaine that is produced according to the most recent estimate from UNODC1 for 2012 (the ONDCP figures for the same year are nearly 175 metric tons of pure cocaine produced on 78,000 hectares2), there are almost 60,000 families who have decided to earn money from growing coca leaves and are linked with complex networks of buyers of coca base (mostly illegal armed groups), distributors of inputs and chemical precursors, and local chains of corruption and transnational mafias dedicated to trafficking cocaine.3
To help the reader understand the flows through the economy associated with the cocaine production chain in Colombia, from planting the seeds to the first stage of wholesaling, this chapter divides production into four stages: (1) the phase of growing and harvesting coca leaves; (2) the primary transformation of coca leaves into coca paste and coca base; (3) the phase where coca base is transformed into cocaine chlorhydrate; and (4) a final stage where wholesalers move the final product (cocaine) to the country’s coasts and borders.4
The first two stages are characterized by the haphazard nature of a peasant-farmer economy, where approximately one-third of the smallholders who grow coca do not directly sell the leaves but transform them into coca paste by means of a relatively simple artisanal process and then sell the paste as an input to the large-scale producers of cocaine (UNODC 2005–2012). This figure has dramatically changed during the past six years; whereas in 2008 two-thirds of coca farmers transformed the leaves into coca paste and base and then sold these products, in 2012 this figure was close to one-third.
It is in the third phase of production where the large flow of money characteristic of the cocaine business begins. Here the profitability of the process increases in terms of both the per-kilogram profit margin and the volume of what is being processed. This stage is characterized by high fixed costs of production, such as the mounting of a workshop for processing cocaine (cristalizadero), which often requires an investment of more than a million dollars. It is in this phase where illegal armed groups, which have the capacity to assume these fixed costs, become directly linked to the cocaine production chain, in some cases by providing security to cocaine-processing facilities and in others as the direct owners and operators of the cristalizaderos.
The final stage consists of the transportation of cocaine to the borders and coasts, where Colombian producers sell the product to intermediary traffickers or join with them to sell it in final markets in the consumer countries.
The sources of information used for the analyses of each of the four stages are mainly the studies published since 2000 by the UNODC and the Integrated Crops Monitoring System (SIMCI) for illegal crops. To develop some of these estimates, the information from the UNODC was complemented with the records of the Colombian Presidency’s Program for the Manual Eradication of Illicit Crops (PCI). Another important source of information are the records, kept by the US government since the 1980s, on production, yields, and the area sown with coca leaves, which are useful for providing reference points for establishing ranges of estimates for revenues from the narcotics trafficking value chain in Colombia.
Finally, the analyses and estimates of domestic cocaine trafficking were based on official records of confiscations of cocaine and chemical precursors kept by the Colombian authorities, which are compiled and validated by the Drugs Observatory in Colombia (Observatorio de Drogas de Colombia) of the Colombian Ministry of Justice.
This chapter is made up of four sections, beginning with this introduction. The following sections describe the aggregate data on the production and prices of cocaine in Colombia, as well as their evolution during the past decade. Section 3 focuses on the quantification of production costs, revenues, and value added in each link of the production chain. Finally, Section 4 summarizes the main results and presents the main conclusions.
AGGREGATE INDICATORS FOR THE PRODUCTION AND PRICES OF COCAINE IN COLOMBIA
According to the UNODC,5 the area devoted to coca growing in Colombia fell from approximately 163,000 hectares in 2000 to nearly 48,000 in 2012. Likewise, the ONDCP estimates that the number of cultivated hectares declined from approximately 140,000 to 78,000 during the same period (Figure 1.1). The figures of the US government (ONDCP) show a cultivated area 50 percent larger on average than the one found in the estimates of the UNODC. The main cause of the difference between the two sources lies in the use of different methodologies for measuring coca plantations (Correa 2007). More precisely, the two methodologies differ in the coverage of the satellite images, the corrections made when interpreting the satellite images, and in the methodologies used for extrapolating the estimates in regions where the satellite images are not very accurate.
The growing of coca leaves is highly concentrated in Colombia (see Figure 1.2). Half of all coca cultivation in Colombia takes place in only three of the thirty-two departments, and 80 percent of all coca cultivation is concentrated in just eight of the departments (UNODC 2013). There were 163 municipalities that had positive levels of coca cultivation in 2011. Half of the cultivation of coca is concentrated in only fourteen municipalities (1.2 percent of total municipalities and 8.6 percent of the municipalities where coca is grown).
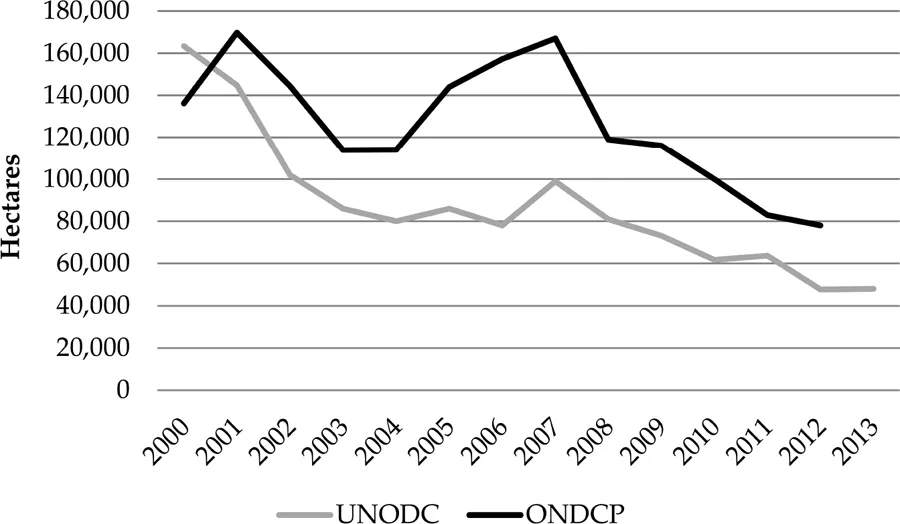
FIGURE 1.1. Coca cultivation in Colombia (hectares). Source: SIMCI-UNODC and ONDCP
One way of measuring the evolution of the concentration of coca crops in Colombia is by means of the Gini coefficient.6 The high concentration of the cultivations of coca in Colombia can be seen in Figure 1.2A, which shows the Lorenz curve associated with the distribution of coca plantations in Colombia in 2011,7 and Figure 1.2B, which shows the evolution of the Gini coefficient for the distribution of coca crops between 2000 and 2011. The Lorenz curve for the distribution of coca plantations shows that there is no coca in 85 percent of the municipalities, whereas they are highly concentrated in the remaining 15 percent of the municipalities. As can be seen in Figure 1.2B, the concentration of coca plantations is high but had been steadily declining until 2009, when it started increasing again. This reduced concentration may be due to the strategy that coca growers have adopted to deal with the intensification of aerial and manual eradication campaigns, since the more separated the plantations are, the more difficult and costly it becomes for the government authorities to detect and destroy the plantations.
The two sources of information about the data on cocaine production in Colombia estimate the potential production of cocaine on the basis of statistics on productivity per hectare per year (e.g., the number of kilograms of cocaine that can be produced in a year on each hectare where coca is grown).8 Using these figures, the UNODC estimates that the potential production of cocaine in Colombia in 2012 was approximately 310 metric tons. The ONDCP, for its part, estimates that the potential production of pure cocaine in the same year was approximately 175 metric tons, which, with an average purity of 85 percent in Colombia, amounts to about 205 metric tons. Figure 1.3 shows the evolution over time of the estimates for the potential cocaine production in Colombia between 2000 and 2012 according to the two sources of information. As can be seen, the production of cocaine in Colombia has fallen by approximately 55 percent since 2000 according to UNODC and by 75 percent since 2001 according to ONDCP estimates.
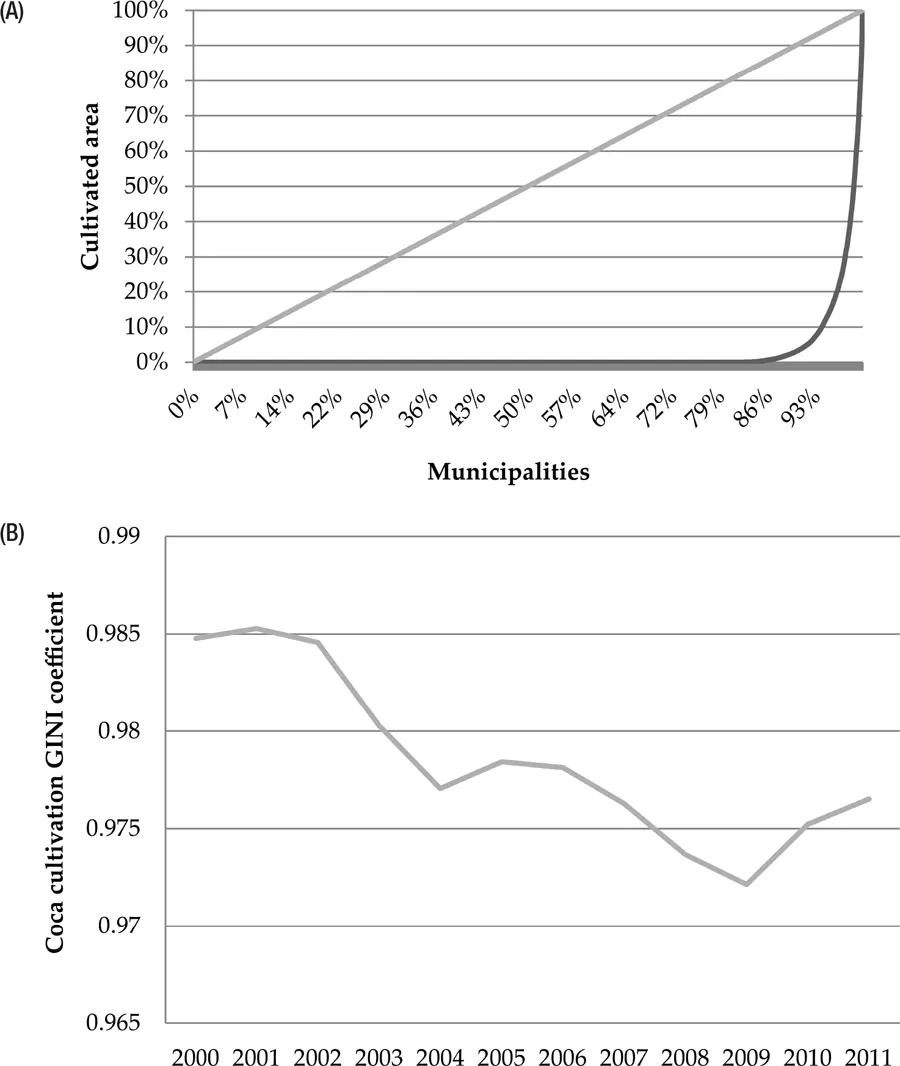
FIGURE 1.2. Concentration of coca crops in Colombia (2000–2011). (A) Lorenz curve—coca crops (2011); (B) Gini coefficient of coca crops (2000–2011). Source: Our own estimates based on data from SIMCI-UNODC
Finally...
Table of contents
- Cover
- Series Page
- Title Page
- Copyright
- Contents
- Acknowledgments
- Preface
- Introduction
- Part I. Dimension of the Drug Problem in Colombia: Production, Trafficking, and Consumption
- Part II. Policies for the Reduction of Supply and Demand
- Part III. International Relations and Anti-Drug Policies in Colombia
- Part IV. Legal and Institutional Aspects of the War on Drugs
- Part V. Institutions and Narcotics Trafficking
- Index
Frequently asked questions
Yes, you can cancel anytime from the Subscription tab in your account settings on the Perlego website. Your subscription will stay active until the end of your current billing period. Learn how to cancel your subscription
No, books cannot be downloaded as external files, such as PDFs, for use outside of Perlego. However, you can download books within the Perlego app for offline reading on mobile or tablet. Learn how to download books offline
Perlego offers two plans: Essential and Complete
- Essential is ideal for learners and professionals who enjoy exploring a wide range of subjects. Access the Essential Library with 800,000+ trusted titles and best-sellers across business, personal growth, and the humanities. Includes unlimited reading time and Standard Read Aloud voice.
- Complete: Perfect for advanced learners and researchers needing full, unrestricted access. Unlock 1.5M+ books across hundreds of subjects, including academic and specialized titles. The Complete Plan also includes advanced features like Premium Read Aloud and Research Assistant.
We are an online textbook subscription service, where you can get access to an entire online library for less than the price of a single book per month. With over 1.5 million books across 990+ topics, we’ve got you covered! Learn about our mission
Look out for the read-aloud symbol on your next book to see if you can listen to it. The read-aloud tool reads text aloud for you, highlighting the text as it is being read. You can pause it, speed it up and slow it down. Learn more about Read Aloud
Yes! You can use the Perlego app on both iOS and Android devices to read anytime, anywhere — even offline. Perfect for commutes or when you’re on the go.
Please note we cannot support devices running on iOS 13 and Android 7 or earlier. Learn more about using the app
Please note we cannot support devices running on iOS 13 and Android 7 or earlier. Learn more about using the app
Yes, you can access Anti-Drug Policies in Colombia by Alejandro Gaviria, Daniel Mejia, Alejandro Gaviria,Daniel Mejia, Jimmy Weiskopf in PDF and/or ePUB format, as well as other popular books in Diritto & Diritto internazionale. We have over 1.5 million books available in our catalogue for you to explore.