A quarter of a century ago, Heather Joshi edited a landmark volume (sponsored by the British Society for Population Studies and the Centre for Economic Policy Research) entitled The Changing Population of Britain. In 2014-15, to mark the 25th anniversary of this book, the BSPS teamed up with the British Academy to hold a series of events on population developments in the UK and the policy issues that they raise, and has built on these presentations to produce a new edited collection on the changing population of the UK.
This book shows that the UK's population is increasing faster than at any point in the last 100 years, it is getting progressively older and it is becoming more diverse culturally and ethnically. More school leavers are going on to university. Cohabitation has been replacing marriage, more children live in one-parent families and young adults are finding it harder to get on the property ladder. Many women are delaying having children until their 40s. Cities have seen a resurgence in population but there is still pressure on the countryside, while the north-south divide is getting ever wider, as too are local socio-economic disparities. The contributors to this book document these changes, examine their causes and discuss future prospects and their policy implications.
eBook - ePub
Population Change in the United Kingdom
- 276 pages
- English
- ePUB (mobile friendly)
- Available on iOS & Android
eBook - ePub
Population Change in the United Kingdom
About this book
Trusted by 375,005 students
Access to over 1.5 million titles for a fair monthly price.
Study more efficiently using our study tools.
Information
Chapter 1
Population Change in the UK: What Can the Last Twenty-Five Years Tell Us about the Next Twenty-Five Years?
Jane Falkingham and Tony Champion
The population of the UK is undergoing some fundamental transformations that have major implications in key areas of the economy, society, politics and environment. The population is currently increasing in size at a faster rate than for several decades, it is growing progressively older and it is becoming more diverse in ethnic and cultural terms. More school leavers are continuing into higher education, sexual behaviour has altered enormously, cohabitation has been replacing marriage, more children are living in one-parent families or with a step-parent, young adults are finding it harder to get on the housing ladder and to establish their own household, and more women are delaying having children until their late thirties and forties. Many cities have seen population resurgence, but there are still pressures on the countryside, the north-south divide is as great as ever and socio-economic disparities between individuals and communities are widening. This chapter aims to provide an overview of the key changes in the size and composition of the population of the UK and of its four constituent countries over the last quarter of a century since the publication of The Changing Population of Britain (Joshi, 1989a), and then looks forward to speculate about what the next twenty-five years might have in store.
POPULATION GROWTH AND THE DRIVERS OF POPULATION CHANGE
Over the past fifty years, the population of the UK has increased by over ten million, from 54 million in 1964 to reach 64.6 million in 2014 (ONS, 2015a). Across this period, however, growth rates have been very uneven, as shown in Figure 1.1. From a high of 0.68 per cent per annum in 1964, reflecting the peak of the 1960s baby boom, over the next decade growth rates fell consistently (with the exception of 1971), and by 1975 annual growth was negative. The UK population actually declined in size between 1975 and 1978, and although positive rates of growth returned, this was short-lived, with 1982 witnessing negative growth of −0.12 per cent per annum, the biggest fall in the postwar period. Population growth rates picked up again in the mid-1980s and then remained fairly stable until the end of the 1990s, at around 0.2 to 0.3 per cent per annum. The dawn of the new millennium marked a change in gear, and growth rates doubled from 0.34 per cent in 2000 to 0.68 per cent in 2006, peaking at 0.82 per cent in 2008 and 0.84 per cent in 2011. Interestingly, although the annual growth rate of the population in the UK in 2014 is very similar to the level witnessed fifty years previously, the drivers behind this current growth are quite different.
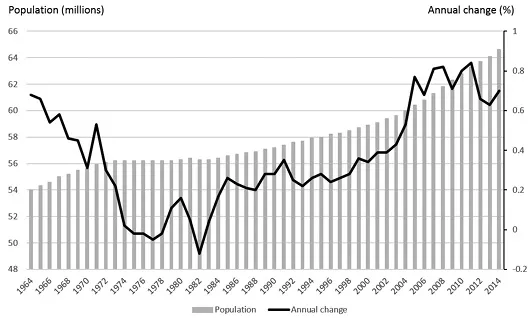
Figure 1.1 Midyear Population Estimates and Annual Change for the UK, 1964–2014.
Source: ONS, NRS, NISRA.
The three demographic processes of fertility, mortality and migration determine the size, composition and distribution of a population. Figure 1.2 shows the trend in the annual number of births and deaths in the UK over the past half century. The number of births peaked in 1964 at just over one million and then fell to a low of 657,000 in 1977, when the number of births was almost exactly matched by the number of deaths, resulting in zero rates of natural increase (i.e., births minus deaths) in the population. Although there was then a slight rise in the number of births, reflecting the fact that those women and men born in the 1960s were now starting to form their own families, the annual number of births did not exceed eight hundred thousand throughout the 1980s and 1990s. During the 1960s, 1970s and 1980s, the growth rates in Figure 1.1 almost exactly track the changes in the number of births in Figure 1.2. Thus, at the time of the publication of the Changing Population of Britain in 1989, it was principally the rate of natural increase (or the lack thereof) that had determined the rate of population growth for the preceding three decades.
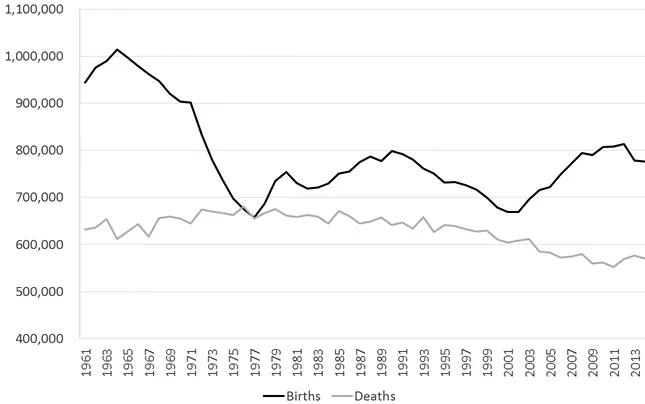
Figure 1.2 Annual Births and Deaths in the UK, 1961–2014.
Source: ONS (2015) Vital Statistics: Population and Health Reference Tables, Summer 2015 update.
The higher growth rate in recent years has been fuelled by a combination of accelerating natural increase and stronger net immigration from abroad, as shown in Figure 1.3. The annual number of births grew steadily from 679,000 in 2000 to nearly 813,000 in 2012, whilst the number of deaths reduced from 610,500 in 2000 to 570,300 in 2014, giving a much more positive rate of natural increase than for any period since the 1960s (Figure 1.2). Meanwhile, net inward migration added an average of over 240,000 persons per year to the UK population between 2004 and 2014. ONS’s estimates of Long Term International Migration (LTIM) show that net migration stood at 336,000 in the year ending June 2015, up from 254,000 in the previous year (ONS, 2015b). EU citizens accounted for 42 per cent of the gross immigration to the UK in 2015, with non-EU citizens comprising 45 per cent and returning British citizens the remaining 13 per cent. The increase in net migration in the mid-2000s was fuelled by the arrival in the UK of migrants from the EU A8 accession countries, most notably Poland, whilst the recent increase in EU immigration in 2014 to 2015 has been partly driven by EU2 (Bulgaria and Romania) citizens. As documented in more detail in Chapter 4 by Jakub Bijak and his colleagues, the majority of these immigrants are in their twenties and thirties and thus of prime reproduction age, so the indirect effect on the size of the population is even greater through their additional contribution to the number of births. Recent data show that around a quarter of all live births in England and Wales in 2014 were to mothers born outside the UK (ONS, 2015c; see also Chapter 5 by Sylvie Dubuc).
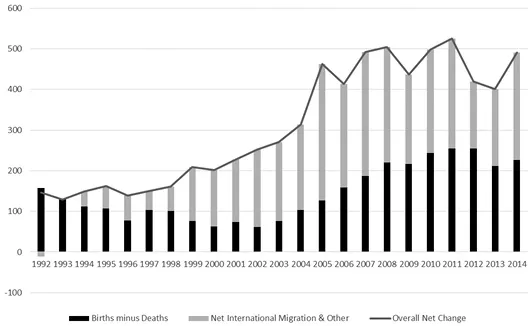
Figure 1.3 Main Drivers of Population Change, mid-1992 Onwards.
Source: Figure 2, ONS (2015a).
The four constituent countries of the UK have not experienced equal population growth. Between 2013 and 2014, whilst the UK as a whole grew by 0.77 per cent, Wales grew by just 0.31 per cent, Scotland by 0.37 per cent and Northern Ireland by 0.59 per cent, with England being the fastest growing at 0.84 per cent. At the regional level within England, the growth rate was highest in London, at 1.45 per cent, followed by the East and South East, at 1.08 per cent and 0.92 per cent, respectively (ONS, 2015a). Although no region of England experienced a population decrease at this time, in some cases this was due to net immigration from overseas offsetting the effect of net migration loss to the rest of the UK. As Chapter 8 shows (see Table 8.2), a net flow into the south and east of England still occurs, but its size fluctuates over time and is much smaller now than in the 1980s, even to the extent that there is a reverse flow in some years.
The most dramatic change in the spatial redistribution compared to a quarter century ago, however, has been at the urban rather than regional scale. As also documented in Chapter 8, the UK has seen an urban resurgence, with the switch from a ‘counter-urbanisation’ pattern of population change (where growth rates are inversely related to settlement size) to one of ‘urbanisation’ (where the largest cities are the fastest-growing places). London led the way in the later 1980s, with other large cities following suit a decade or so later. Higher rates of immigration have been the main driver of this urban recovery, along with stronger natural increase, but a contributory factor has been a reduction in the rate of migration from town to country. The latter was particularly marked during the 2008–2009 recession and its immediate aftermath, but its onset predates then, and the subsequent rebound has been slower than after previous recessions, raising questions about whether a different migration regime may be merging—one that may involve a general decline in people’s frequency of moving home, as is now being observed in the USA (see Chapter 8 for more detail).
How does the UK compare with other countries in terms of overall growth rate? With a population of 64.4 million, in 2014 the UK had the third largest population in Europe (excluding Russia), just behind France (65.8 million) and Germany (80.7 million) (ONS, 2015d). However, its growth rate of 0.7 per cent was over twice that of Germany (0.3 per cent) and higher than France (0.42 per cent), meaning that other things remaining equal, the UK might look set to move up the EU population league table. However, these data predate the impact of the wave of migrants from Syria, the Middle East and North Africa that arrived in Europe during 2015–2016, many of whom have settled in Germany and France, bolstering their growth rates.
CHANGING COMPOSITION OF THE POPULATION
As well as increasing in size, the composition of the UK population has changed significantly across the last quarter century, most notably becoming older and significantly more ethnically diverse.
Changing Age Structure
Past trends in fertility, mortality and migration all influence the age structure of the population. Births determine the number of people entering the population at its base, and the trends in births presented previously in Figure 1.2 can be clearly seen in Figure 1.4, which shows the UK population by single year of age in 2014. The people born in the peak birth cohort of 1964 are now aged fifty, whilst those born in the baby boom that occurred immediately following the end of World War II, in 1946 and 1947, are aged sixty-six to sixty-seven. Interestingly, however, although the ‘baby bust’ years of the 1970s are also clearly visible in the dip in the number of people currently aged in their mid-thirties, the numbers in their twenties and mid-thirties are much higher than would be signposted purely by the number of births twenty to thirty years earlier—with their ranks swelled by the in-migration of young people of working age during the past decade.
The UK, in common with all the countries of Europe, is ageing, with the median age of the population having increased from 33.9 years in 1974 to 40.0 years in 2014, an average rise of 1.5 years each decade. However, the UK has been ageing less rapidly than, for example, Germany, where the median age in 2014 was 45.6, and Italy, where it was 44.7 (Eurostat, 2015), reflecting the arrival of younger migrants in the UK combined with its higher birthrate.
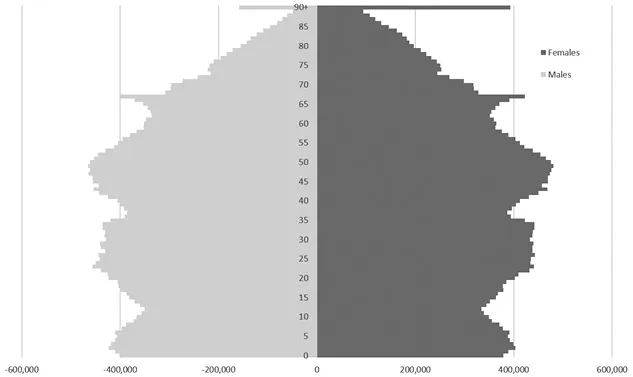
Figure 1.4 UK Population by Single Year of Age, 2014.
Source: Figure 2, ONS (2015a).
Even so, there are now more older people living longer than ever before. Mortality rates have fallen at all ages over the past fifty years, and these improvements have been most significant amongst infants and for those aged fifty-five and over. Improvements in survivorship mean that the onset of old age is being delayed (see Falkingham, 2016). If one thinks of the onset of ‘old age’ as being when there is a 1 per cent chance of dying and the onset of ‘older old age’ as being when there is a 10 per cent chance of dying, it is clear that ‘old age’ is being increasingly postponed. Levels of mortality that used to prevail for people aged in their early fifties are now prevailing in the early sixties; for men, the age when there is first a 1 per cent of chance of dying has risen from fifty-two in 1955 to sixty-three in 2015, and for women it has shifted from fifty-eight to sixty-eight. Similarly, the onset of ‘older old age’ has moved from seventy-seven for men in 1955 to eighty-six in 2015, and from eighty to eighty-eight amongst women (ONS, 2015e). The good news is that sixty really is the new fifty.
One of the most noteworthy changes in the UK population over the past twenty-five years has been a rise in the proportion aged ninety and over. This has been the fastest growing age group. In 1989, when the Joshi volume was published, people aged ninety and over accounted for 0.4 per cent of the population (403 per every 100,000 UK residents); in 2014 this figure had more than doubled to 0.8 per cent (853 per every 100,000 UK residents). Moreover, in 1989 there were just 4...
Table of contents
- Cover-Page
- Halftitle
- 1 Population Change in the UK: What Can the Last Twenty-Five Years Tell Us about the Next Twenty-Five Years?1
- 2 The Ageing Population: Implications for Health and Social Care
- 3 Inequalities in the Experience of Later Life: Differentials in Health, Wealth and Well-Being
- 4 International Migration and Asylum Seekers
- 5 Immigrants and Ethnic Fertility Convergence
- 6 Children’s Changing Family Context
- 7 Household Composition and Housing Need
- 8 Internal Migration and the Spatial Distribution of Population
- 9 Ethnic Diversity
- 10 Reproductive and Sexual Behaviour and Health
- 11 The Changing Geography of Deprivation in Britain, 1971–2011 and Beyond
- Bibliography
- Index
- List of Contributors
Frequently asked questions
Yes, you can cancel anytime from the Subscription tab in your account settings on the Perlego website. Your subscription will stay active until the end of your current billing period. Learn how to cancel your subscription
No, books cannot be downloaded as external files, such as PDFs, for use outside of Perlego. However, you can download books within the Perlego app for offline reading on mobile or tablet. Learn how to download books offline
Perlego offers two plans: Essential and Complete
- Essential is ideal for learners and professionals who enjoy exploring a wide range of subjects. Access the Essential Library with 800,000+ trusted titles and best-sellers across business, personal growth, and the humanities. Includes unlimited reading time and Standard Read Aloud voice.
- Complete: Perfect for advanced learners and researchers needing full, unrestricted access. Unlock 1.5M+ books across hundreds of subjects, including academic and specialized titles. The Complete Plan also includes advanced features like Premium Read Aloud and Research Assistant.
We are an online textbook subscription service, where you can get access to an entire online library for less than the price of a single book per month. With over 1.5 million books across 990+ topics, we’ve got you covered! Learn about our mission
Look out for the read-aloud symbol on your next book to see if you can listen to it. The read-aloud tool reads text aloud for you, highlighting the text as it is being read. You can pause it, speed it up and slow it down. Learn more about Read Aloud
Yes! You can use the Perlego app on both iOS and Android devices to read anytime, anywhere — even offline. Perfect for commutes or when you’re on the go.
Please note we cannot support devices running on iOS 13 and Android 7 or earlier. Learn more about using the app
Please note we cannot support devices running on iOS 13 and Android 7 or earlier. Learn more about using the app
Yes, you can access Population Change in the United Kingdom by Tony Champion,Jane Falkingham, Tony Champion, Jane Falkingham in PDF and/or ePUB format, as well as other popular books in Social Sciences & Demography. We have over 1.5 million books available in our catalogue for you to explore.