In the previous chapter we built a model. In this chapter, we are going to discuss different ways of assessing and improving the results of a model. In addition, you will also begin to learn how to use your models in the real world. Specifically, we will cover the following topics:
As we briefly discussed in Chapter 1, Introduction to Data Mining and Predictive Analytics, model assessment (a modeling phase task) is quite different from the Evaluation phase. Some of the same tools can apply to both, but the stage of the project and the thought process is quite different. During model assessment, you are potentially comparing a large number of models. You may even try dozens of variations of algorithms, settings, and modifications to the data.
Therefore, you need easy, objective criteria on which to rank these models. Our colleagues and management simply will not have the time to be brought in to judge the efficacy of dozens of models so we need to narrow it down to just a couple of models before the Evaluation phase begins. Tom Khabaza, one of the original authors of CRISP-DM has written the Nine Laws of Data Mining (http://khabaza.codimension.net/index_files/9laws.htm) and the 8th Law of Data Mining is the Value Law, which states:
The value of data mining results is not determined by the accuracy or stability of predictive models.
Well, in this lesson, particularly in the Analysis node section, we are going to focus on the accuracy and stability of a model. So, what is this law getting at? An extended quote will help make the distinction:
Accuracy and stability are useful measures of how well a predictive model makes its predictions. Accuracy means how often the predictions are correct (where they are truly predictions) and stability means how much (or rather how little) the predictions would change if the data used to create the model were a different sample from the same population. Given the central role of the concept of prediction in data mining, the accuracy and stability of a predictive model might be expected to determine its value, but this is not the case.
The value of a predictive model arises in two ways:
- The model's predictions drive improved (more effective) action.
- The model delivers insight (new knowledge), which leads to improved strategy.
So the important thing here is that when we move beyond model assessment and into evaluation, we have to shift our focus from accuracy and stability to action and strategy. We need an intervention strategy that uses our predictions to drive action. The Evaluation phase will be to measure, as specifically as possible, how the improved actions produced measurably better results. Better is usually measured in dollar terms, but not always. So, we have to return our project to the language of the business and compare our performance to the specific goals laid out in the Business Understanding phase.
![]()
When a model seems satisfactory based on performance, fields included, and the relationships between the predictors and the target, the next step is model assessment. Formally, model evaluation is the assessment of how a model performs on unseen data. Modeler makes this easy because of the Partition field.
We previously used the Partition node to split the data file into Testing and Training partitions. In the previous chapter, we were careful when studying the model not to use the Testing partition. Doing so would compromise model testing because we would learn how well the model performed on the unseen data. In this chapter, we will use the Analysis and Evaluation nodes to further assess our model.
The Analysis node allows you to evaluate the accuracy of a model, and it organizes output by the Partition field values. Analysis nodes perform various comparisons between predicted values and actual values for one or more generated models. The Analysis node is contained in the Output palette:
- Open the Assessment stream.
- Add an Analysis node from the Output palette.
- Connect the generated CHAID model to the Analysis node.
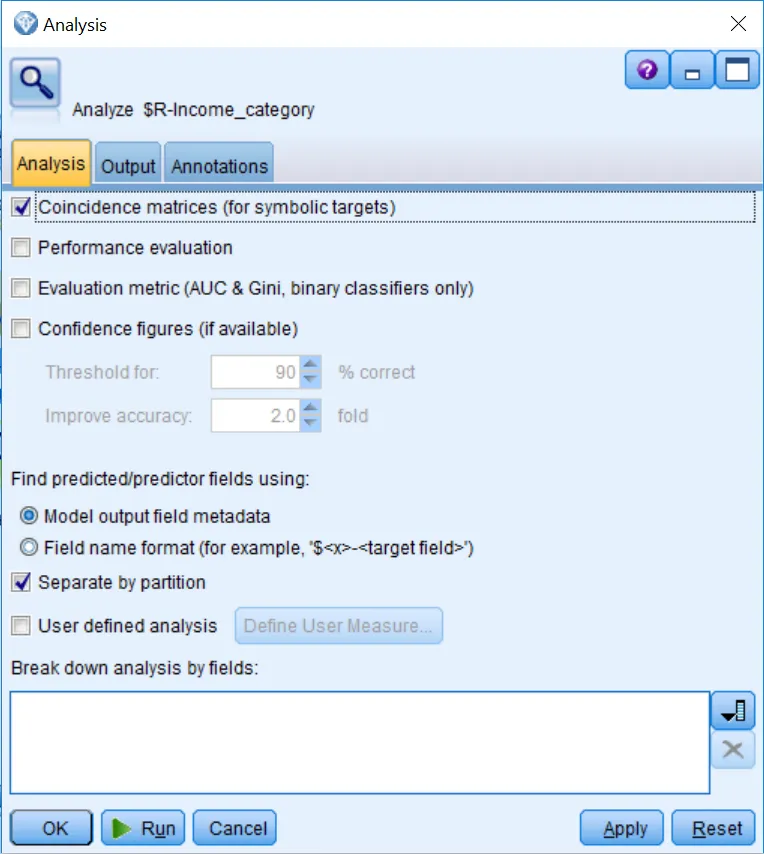
- Edit the Analysis node:
The Analysis node provides several types of output. Coincidence matrices (for symbolic targets) are cross tabulations between the predicted and actual values. The Confidence figures (if available) option provides summary information for models that produce confidence values.
By default, the Analysis node will organize output by the Partition field. We can also ask that all the output be broken down by one or more categorical fields:
- Click Coincidence matrices (for symbolic targets).
- Click Run:
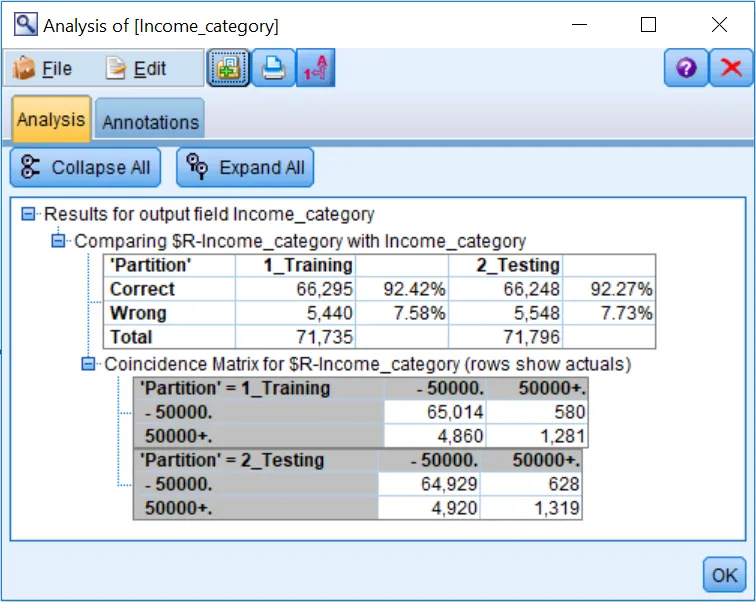
The table shows the overall accuracy of the model in the Training and Testing partitions. When we were examining the CHAID model, we only saw information on the Training dataset and rule specify accuracy; here we are provided with the overall model accuracy.
As we can see from the output, the overall accuracy of the CHAID model on the Training data is 92.42%. Whether this level of accuracy is acceptable will depend on many factors. More important is how well the model performed on the unseen Testing dataset. The accuracy of the CHAID model for the Testing group is the fundamental overall test of the model. If the accuracy on the Testing data is acceptable, then we can deem the model validated.
For this data , the Testing dataset accuracy is 92.27%. The typical outcome when Testing data is passed through a model node is that the accuracy drops by some amount. If accuracy drops or changes by a large amount (about 5%), it suggests that the model overfit the Training data or that the validation data differed in some systematic way from the Training data (although the random sampling done by the Partition node minimizes the chance of this). If accuracy drops or changes by only a small amount, it provides evidence that the model will work well in the future; that is, we have a reliable model that will generalize to new data. When this is favorable, the model is described as being stable. The small change of 0.15% in accuracy from the Training to the Testing data indicates that the CHAID model is validated.
In summary, we are focused on two questions:
- Is the test accuracy value sufficiently high
- Is the stability sufficient—as revealed by a small difference between train and test accuracy
The Coincidence Matrix table will be of special interest when there are target categories in which we ...